Sanborn, Rao et al. 2015 Media Kit
Latest version of the video:
http://aidenlab.org/sanbornraomediakit2015/video.html
Embed Instructions for the video:
<iframe width="420" height="320" src="http://aidenlab.org/sanbornraomediakit2015/video.html" scrolling="no" frameborder="0" allowfullscreen></iframe>
The human genome is two meters long but fits inside the microscopic nucleus of a cell. How does it do this? Our work suggests that the genome forms loops and domains through a process called extrusion!
Adrian L. Sanborn*, Suhas S. P. Rao*, Su-Chen Huang, Neva C. Durand, Miriam H. Huntley, Andrew Jewett, Ivan D. Bochkov, Dharmaraj Chinnappan, Ashok Cutkosky, Jian Li, Kristopher P. Geeting, Andreas Gnirke, Alexandre Melnikov, Doug McKenna, Elena K. Stamenova, Eric S. Lander, Erez Lieberman Aiden. Chromatin extrusion explains key features of loop and domain formation in wild-type and engineered genomes. Proceedings of the National Academy of Sciences (in press).
(Mini Video) Depiction of how loop extrusion packages the genome. First, an extrusion complex attaches to DNA at two nearby locations, forming a small loop. Next, two sides of the complex slide along the DNA in opposite directions while remaining tethered, growing the loop. Sliding halts when a complex encounters a specific DNA motif of the matching orientation. A loop is formed, and the intervening DNA is organized into a domain.
(Mini Video) A simulation of DNA loops and domains forming through loop extrusion. In the extrusion model, an extrusion complex (yellow) containing two subunits first attaches to DNA, forming a small loop. Next, the two subunits slide along the DNA in opposite directions, growing the loop.
The extrusion complex looks for a specific motif (purple triangles) which causes a protein called CTCF to bind to the DNA. If a subunit encounters a CTCF motif that is pointing at it, the subunit tends to stop. If the CTCF motif is pointing in the other direction, the motif won't be recognized.
A schematic of the extrusion process is shown below the simulation. Two domains are formed, shown in red and blue.
(Mini Video) A globule of DNA containing two spatially segregated loop domains formed by extrusion, labeled in red and blue. Loops formed by extrusion are unknotted, so they can be readily expanded, allowing access to the genetic information they contain.
(Mini Video) Close-up on a single extrusion complex in a computer simulation of DNA extrusion. First, an extrusion complex containing two subunits attaches to DNA, forming a small loop. Next, the two subunits slide along the DNA in opposite directions, while remaining physically tethered, growing the loop.
(Mini Video) Six chains collapsed in a globule, representing parts of six chromosomes. Each chain is colored its own color. Initially, the chains are intermixed. As each chain undergoes loop extrusion, the chains become spatially segregated, demonstrating the formation of chromosome territories through extrusion.
-
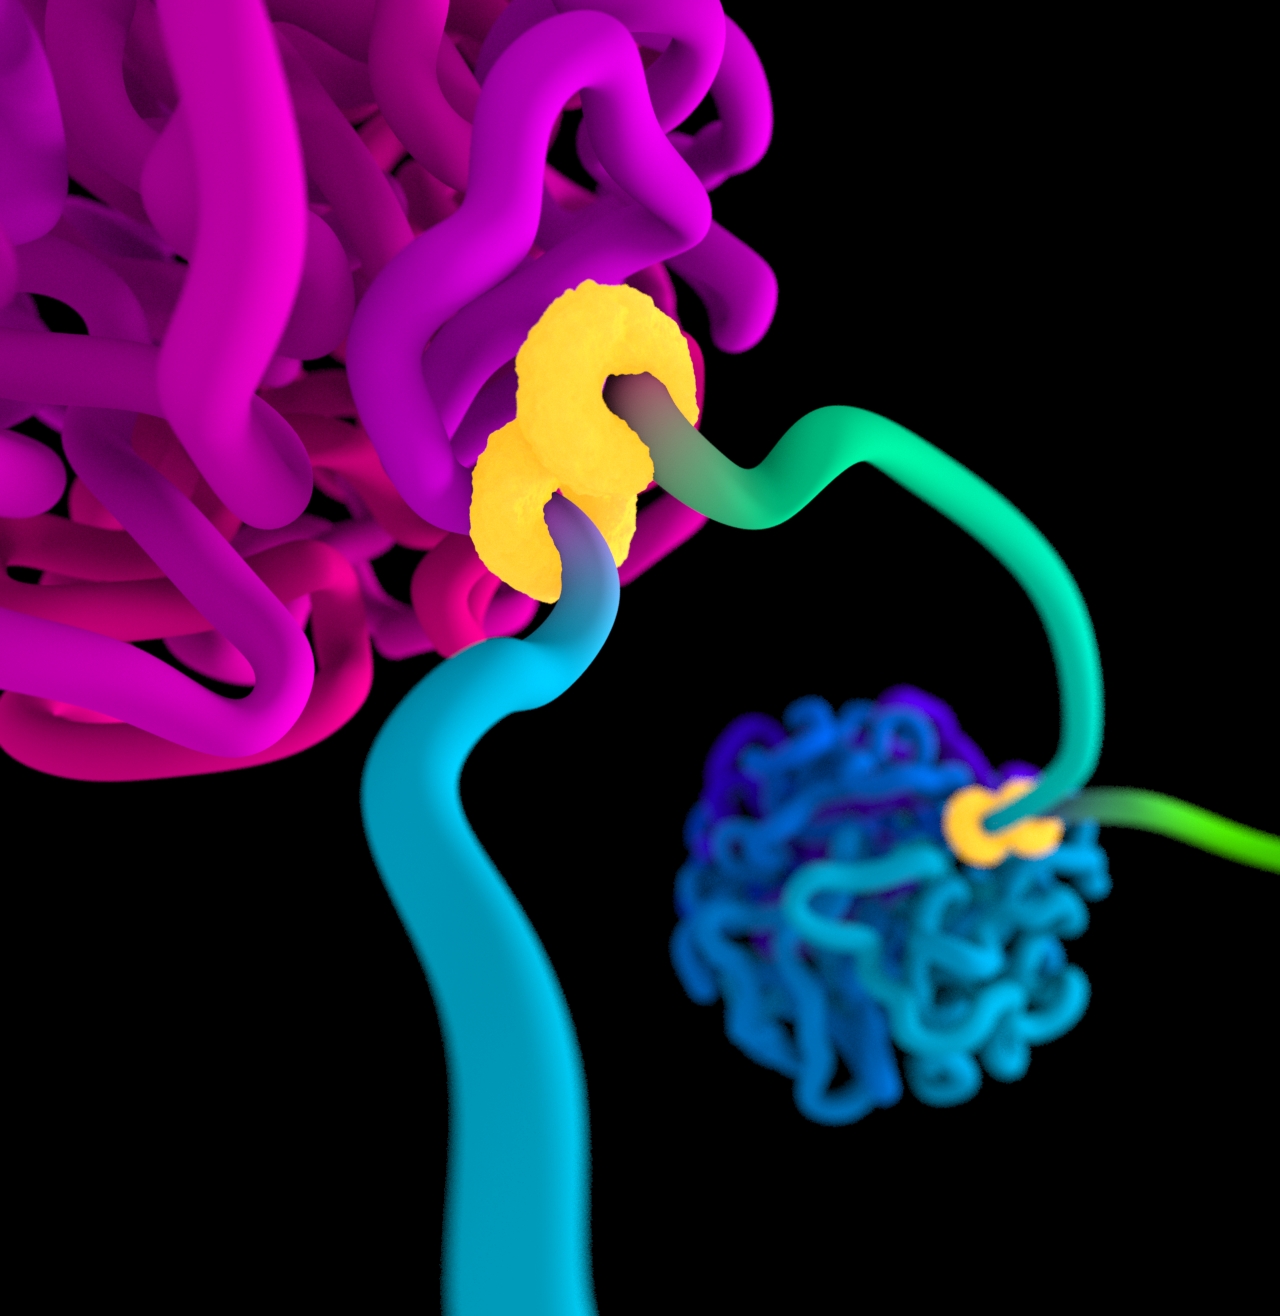
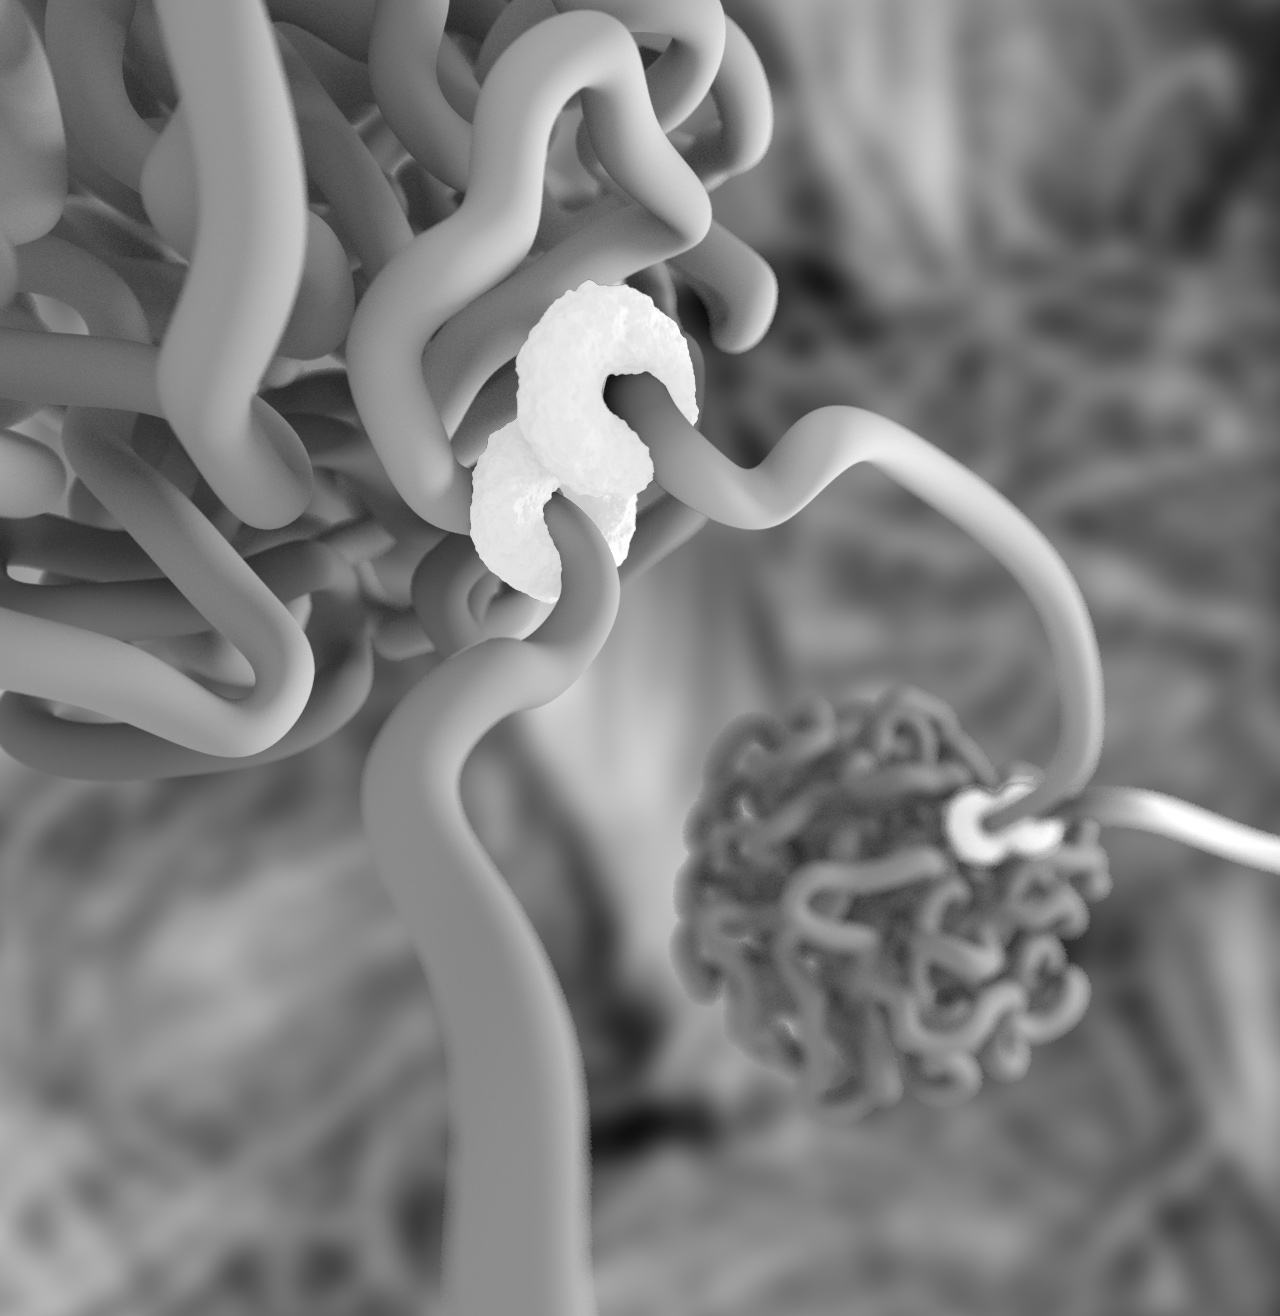
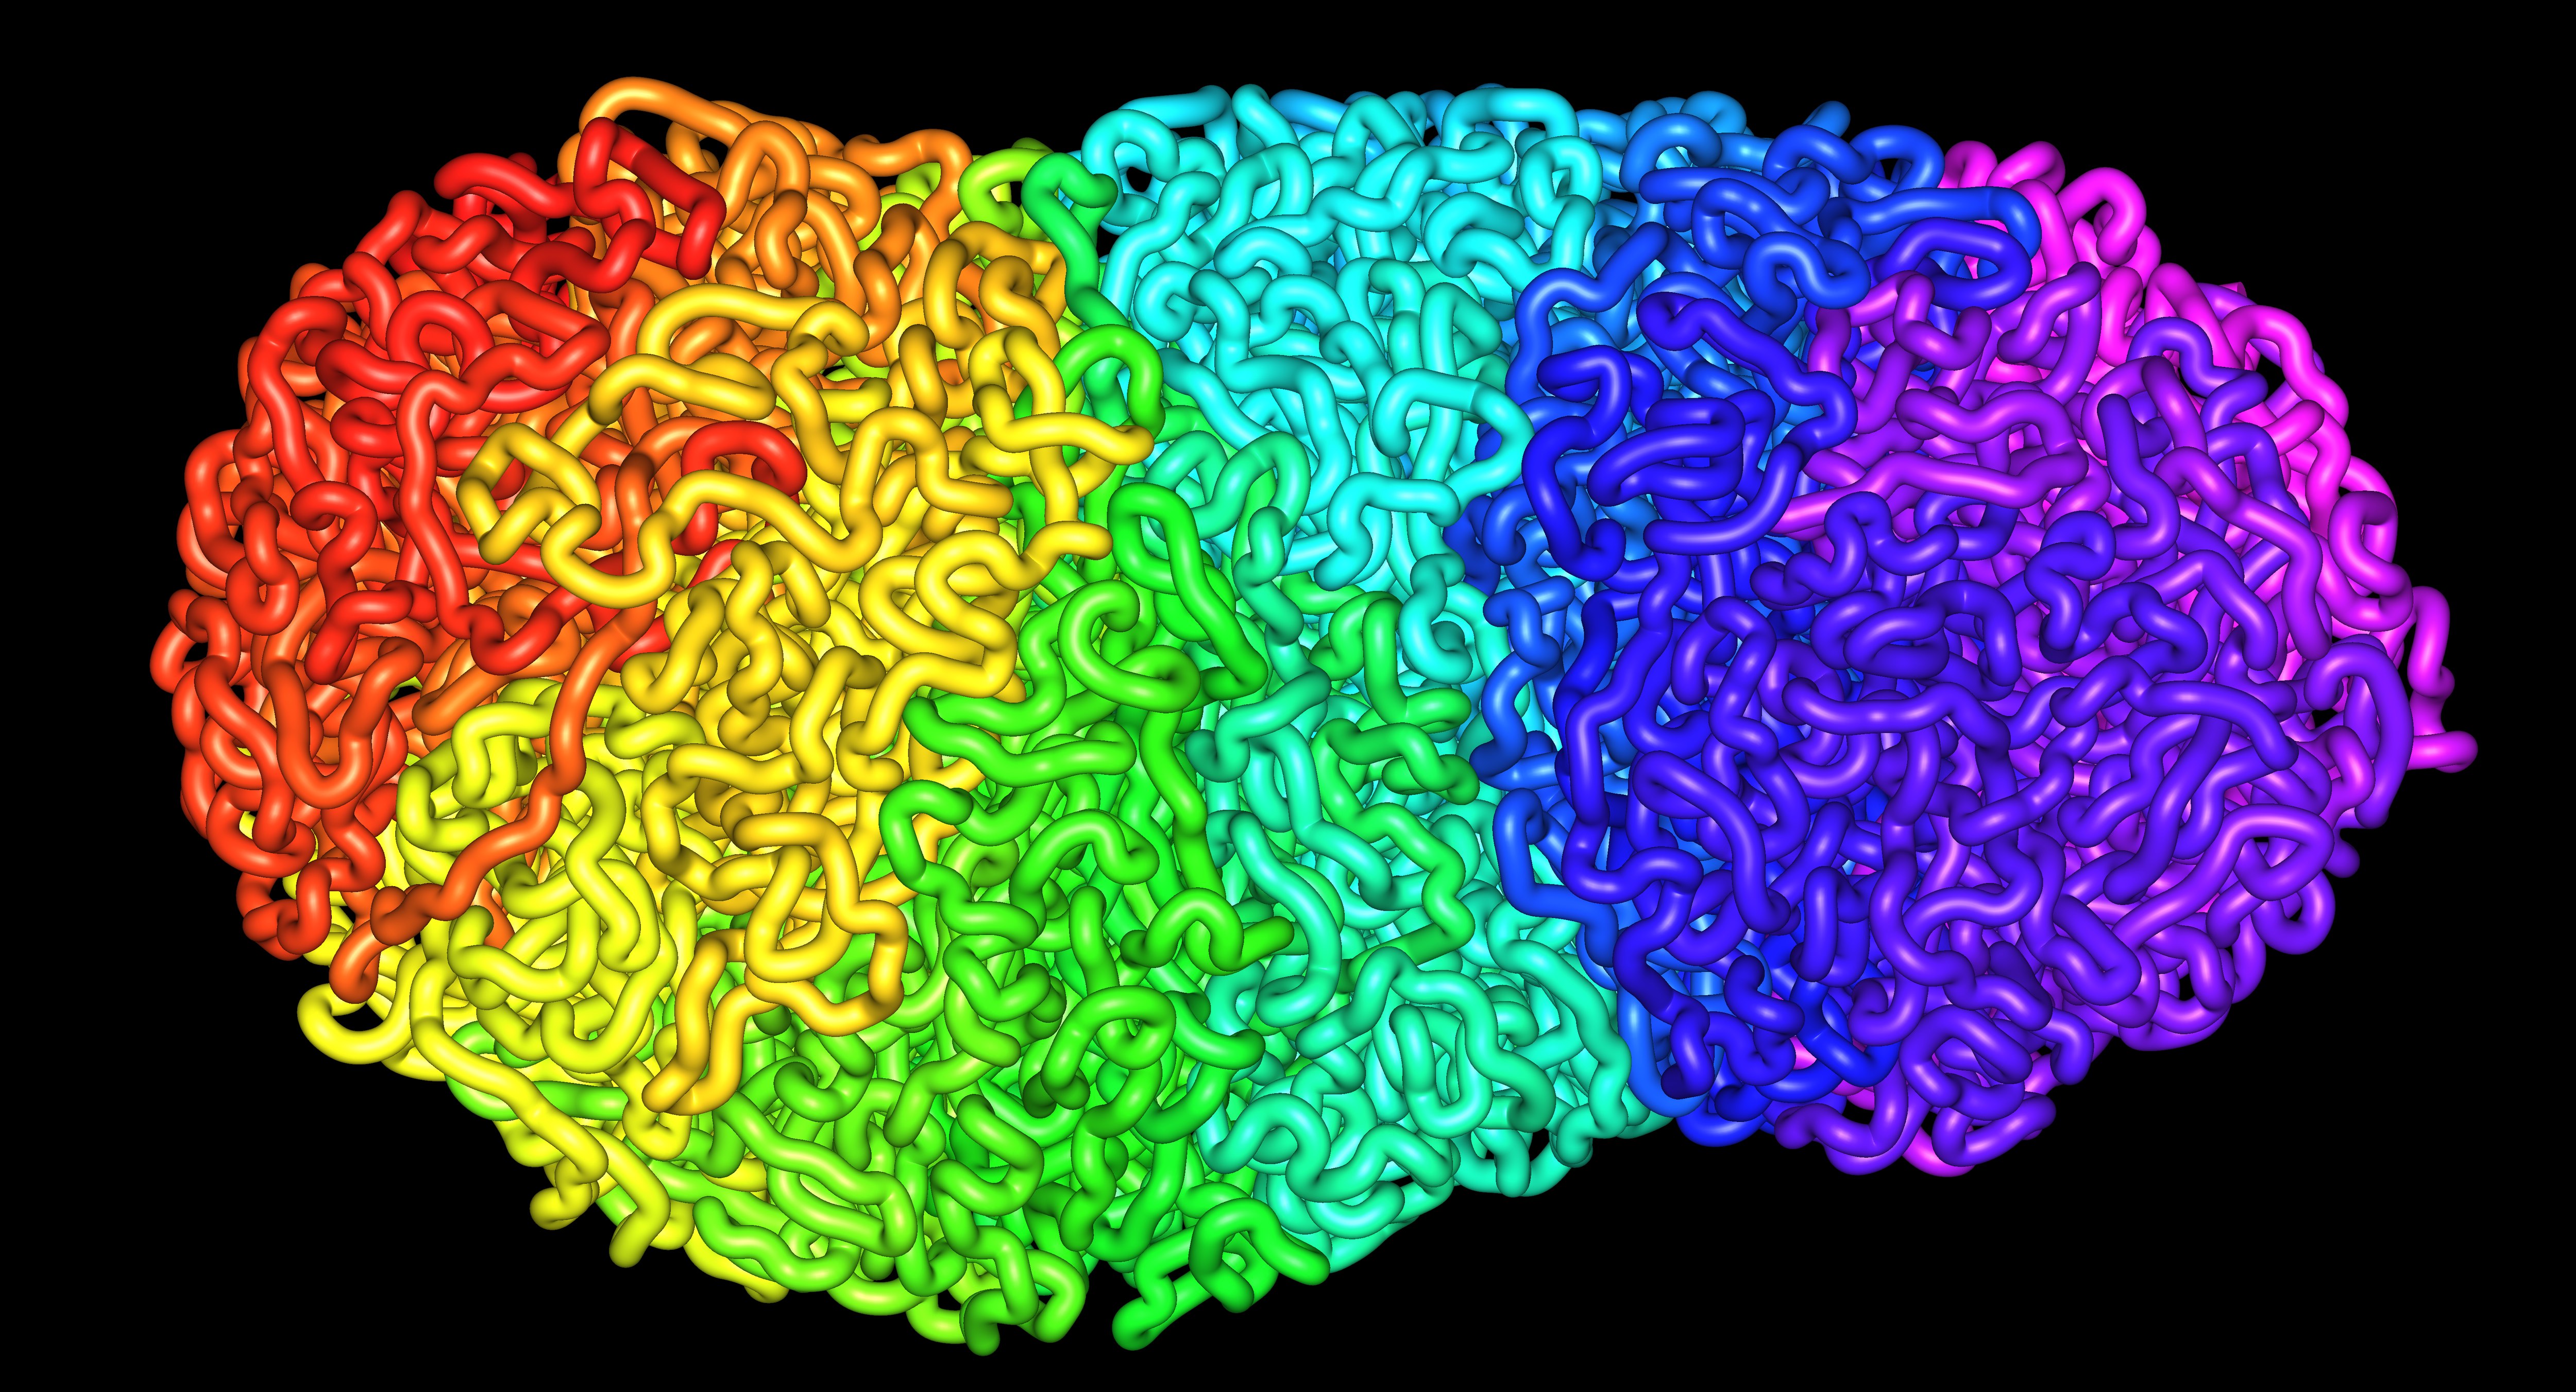
Extrusion Globule 1
Simulation of DNA organized into two globules by loop extrusion. The figure-8 structure indicates the extrusion complex.
Credit: Najeeb Marc Tarazi, Adrian Sanborn, Erez Lieberman Aiden. -
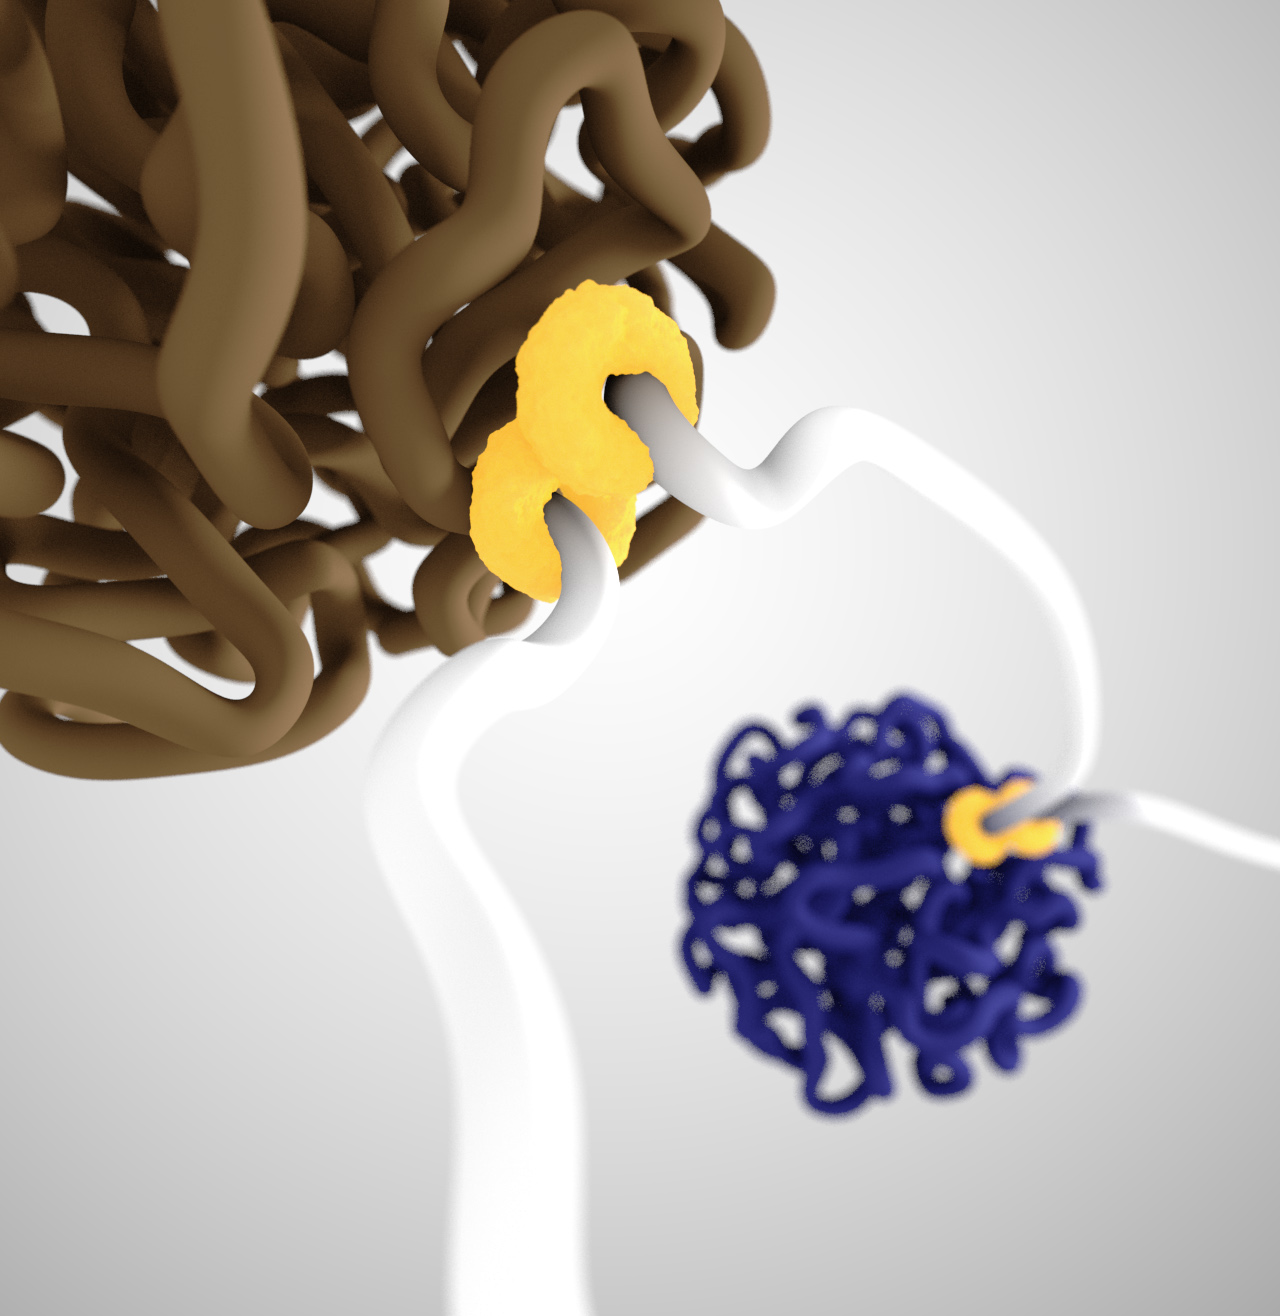
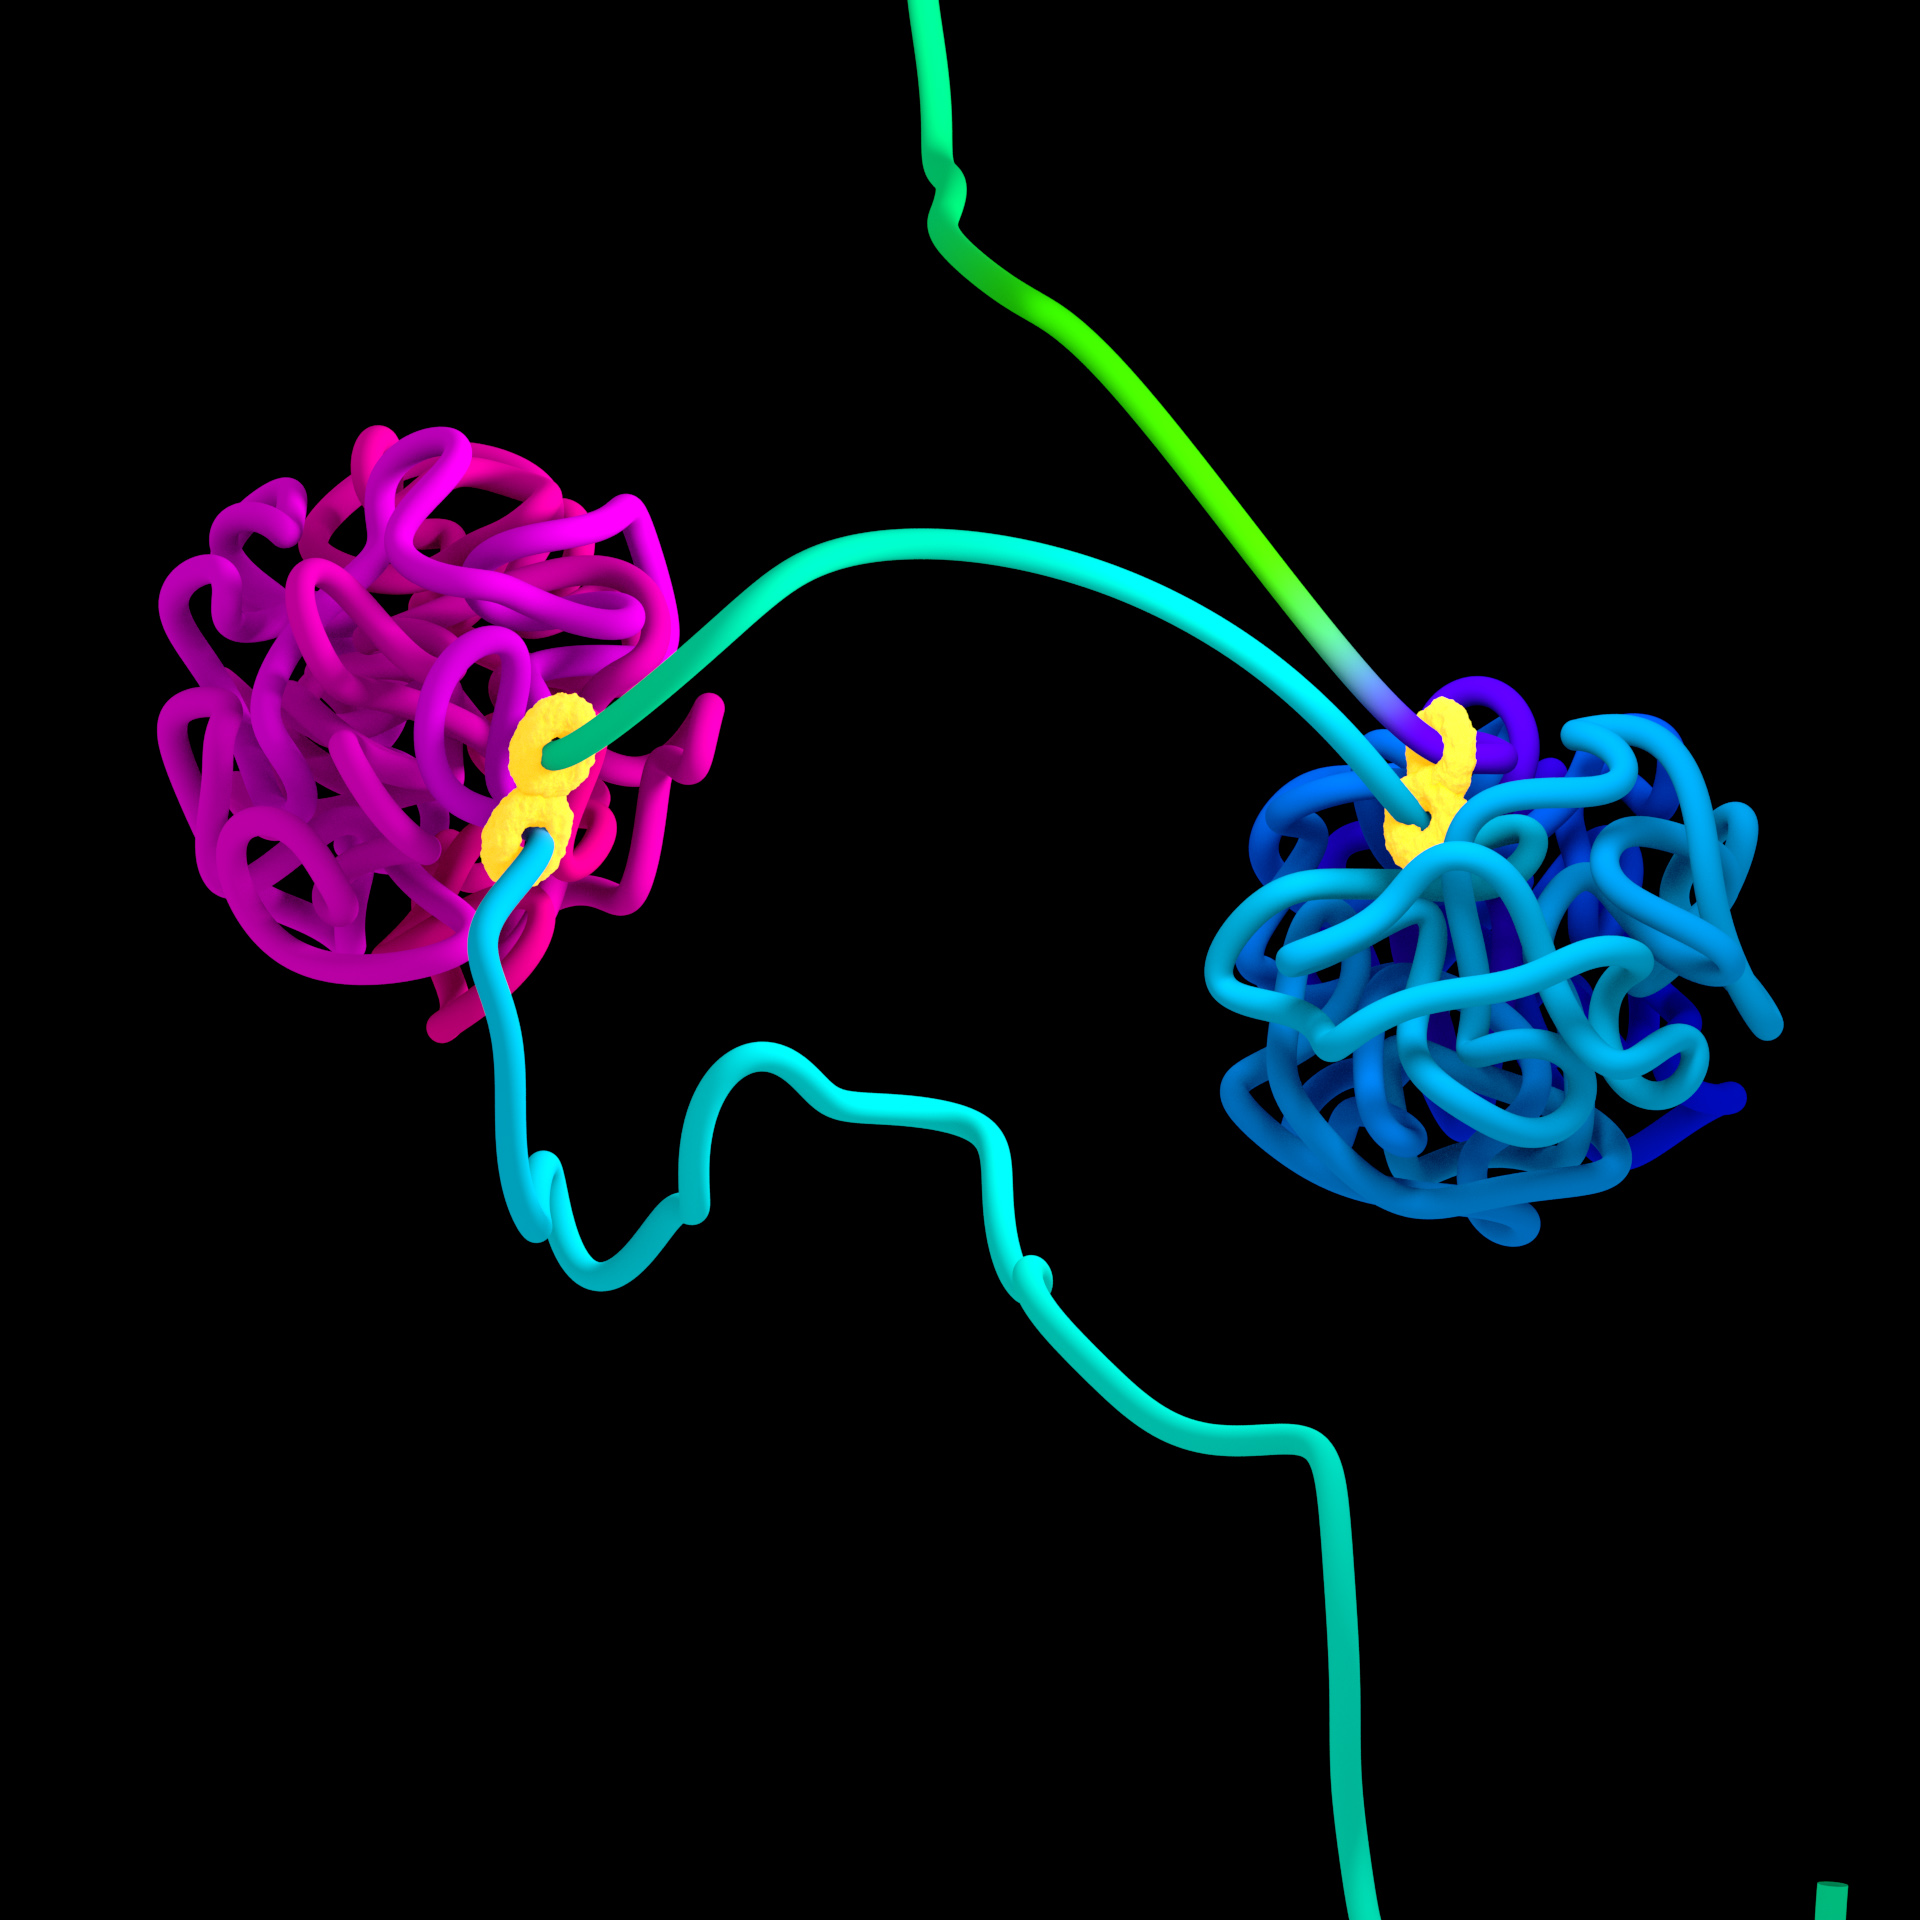
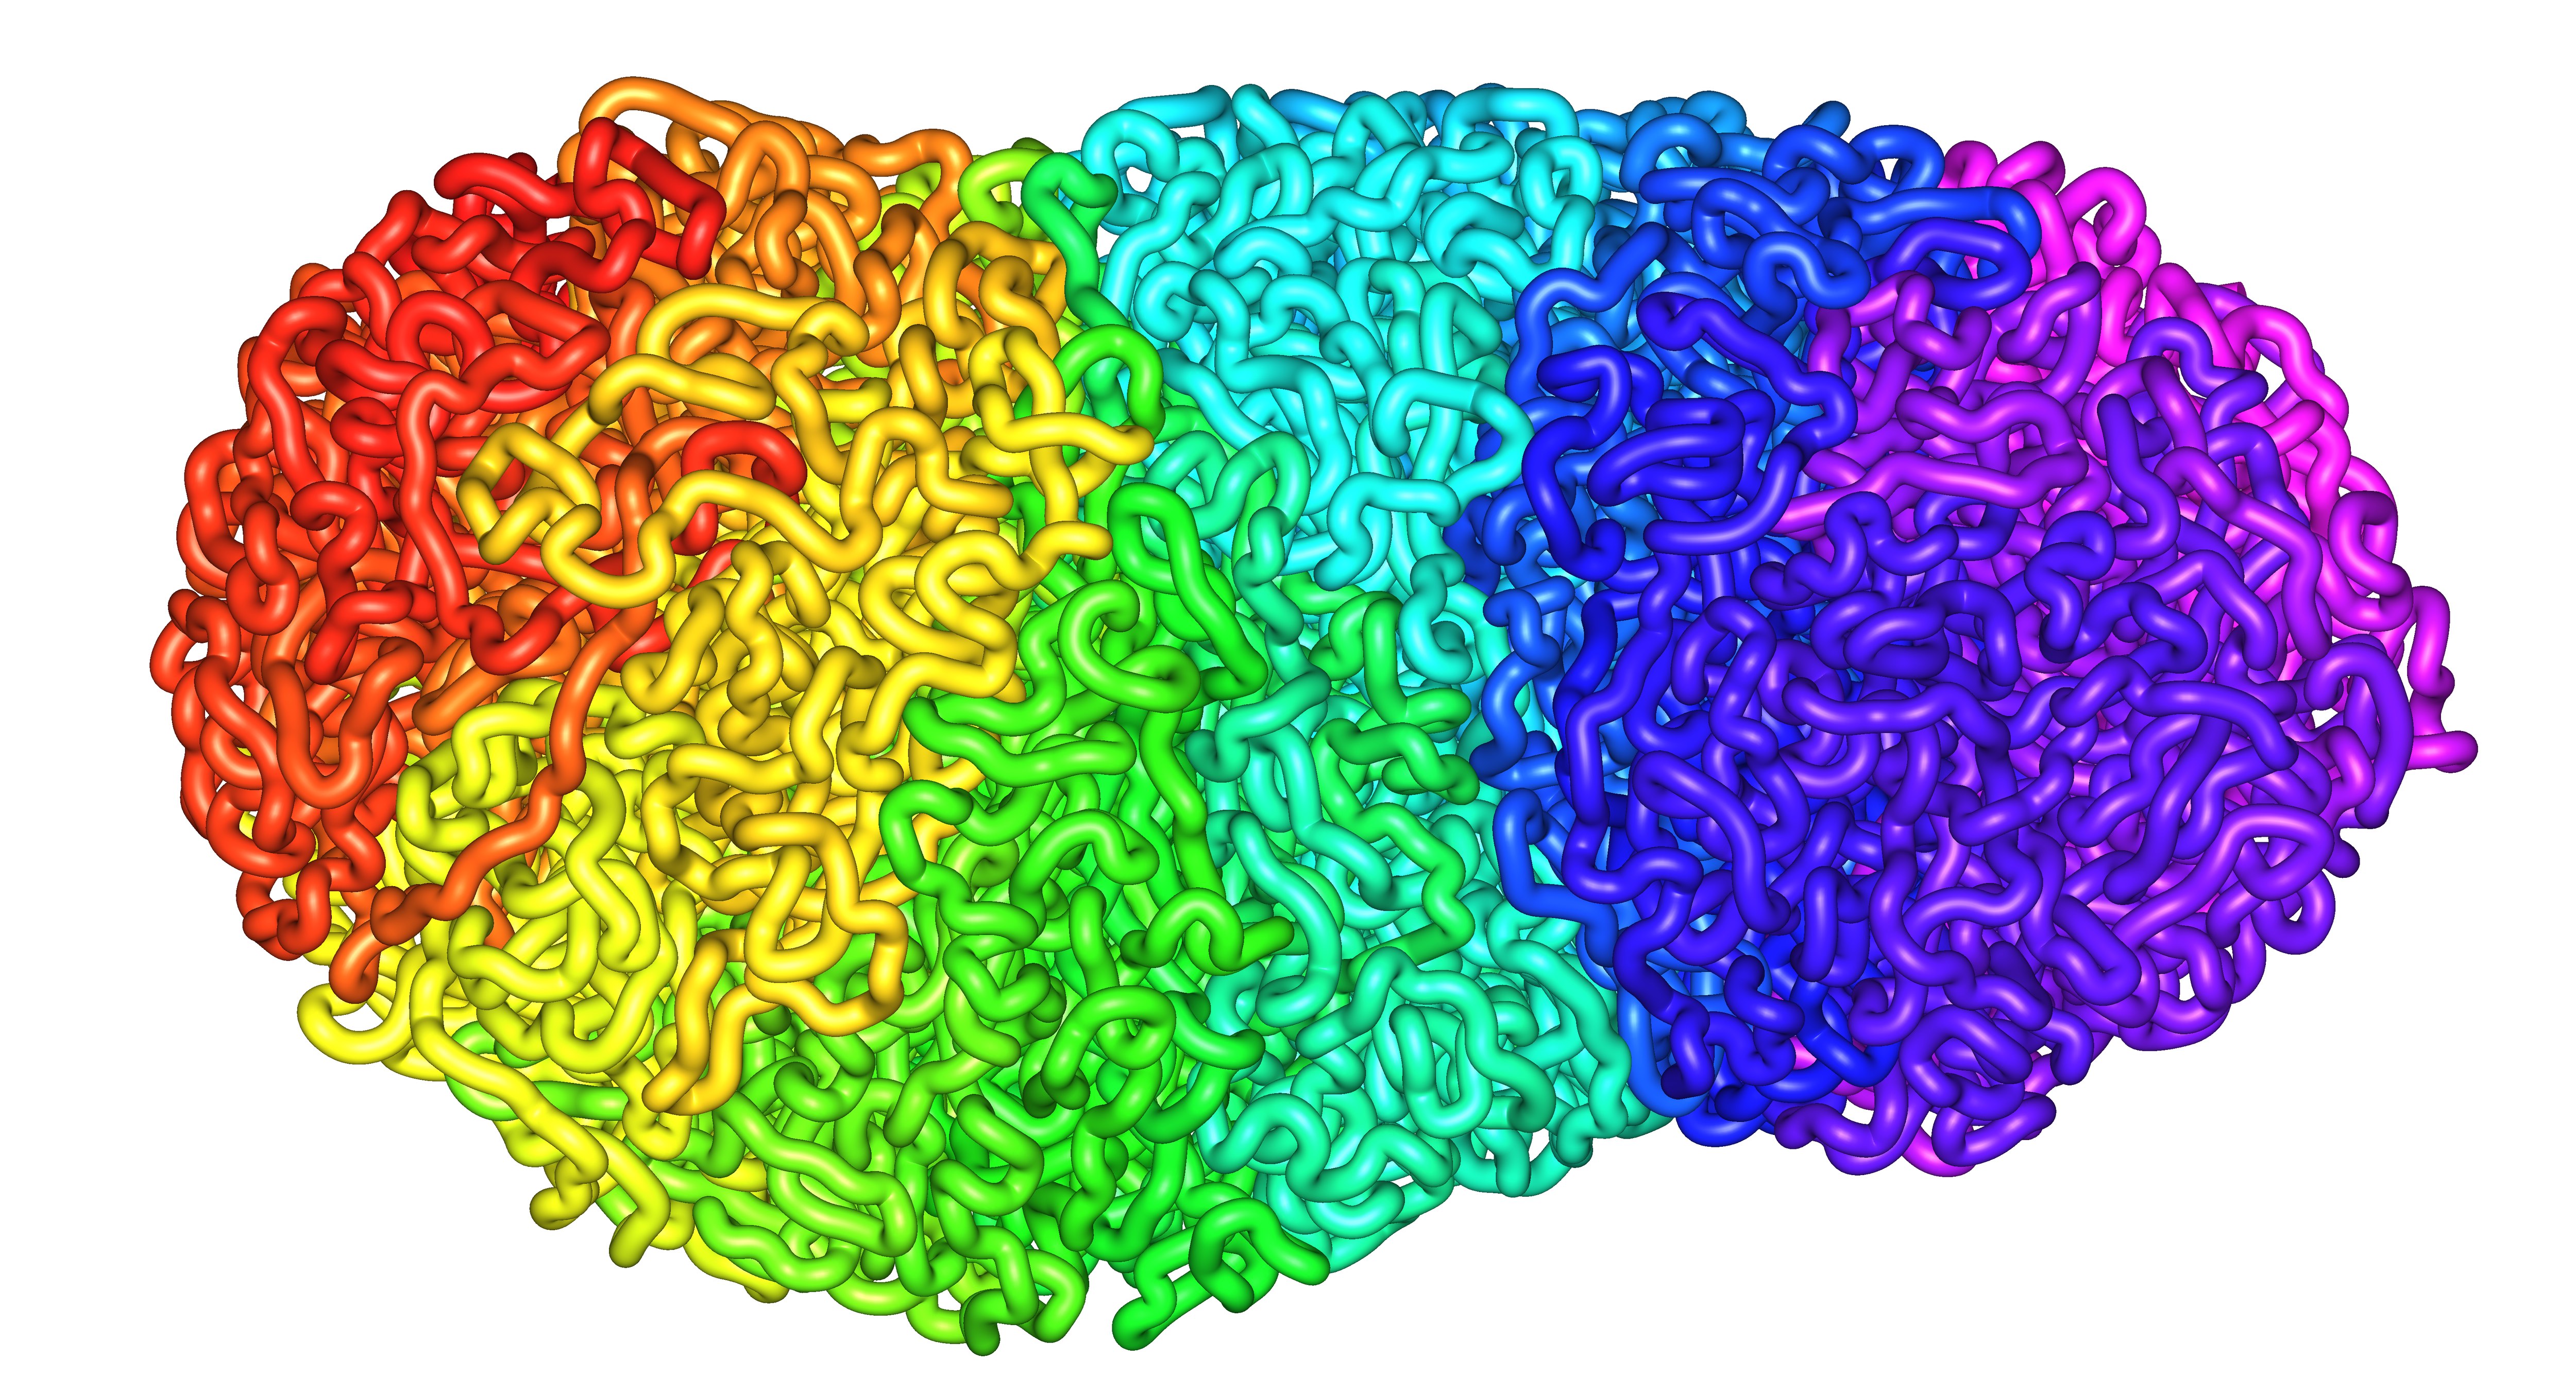
Extrusion Globule 2
Simulation of DNA organized into two globules by loop extrusion. The figure-8 structure indicates the extrusion complex.
Credit: Najeeb Marc Tarazi, Adrian Sanborn, Erez Lieberman Aiden. -
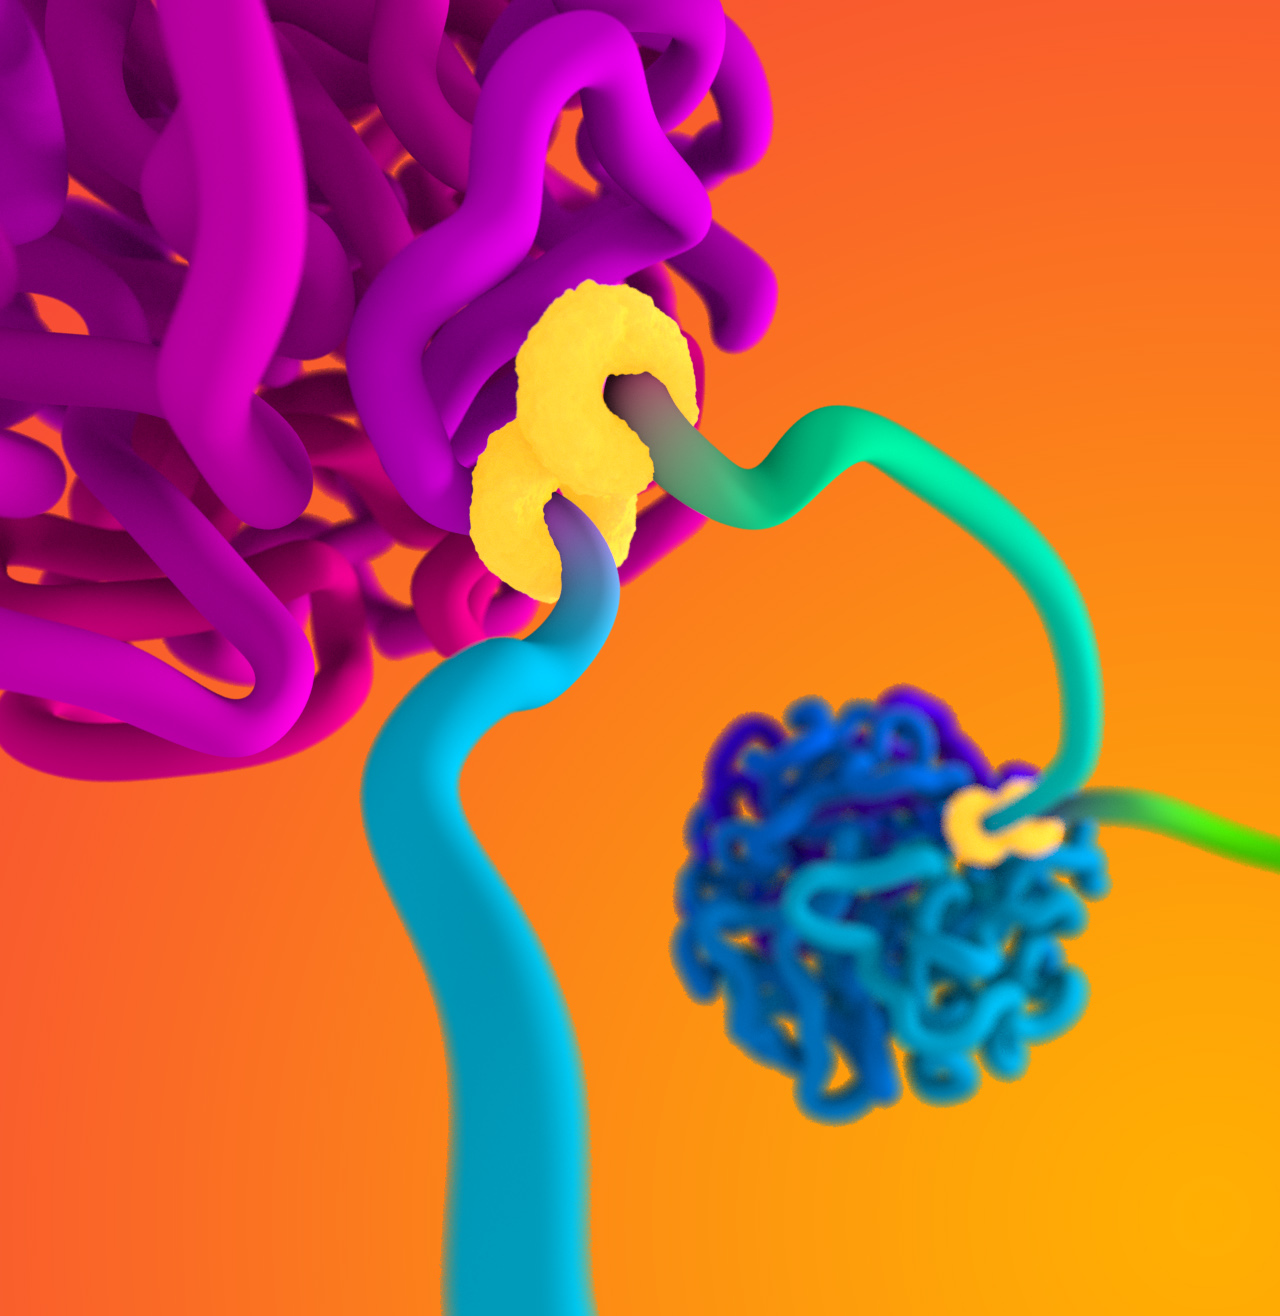
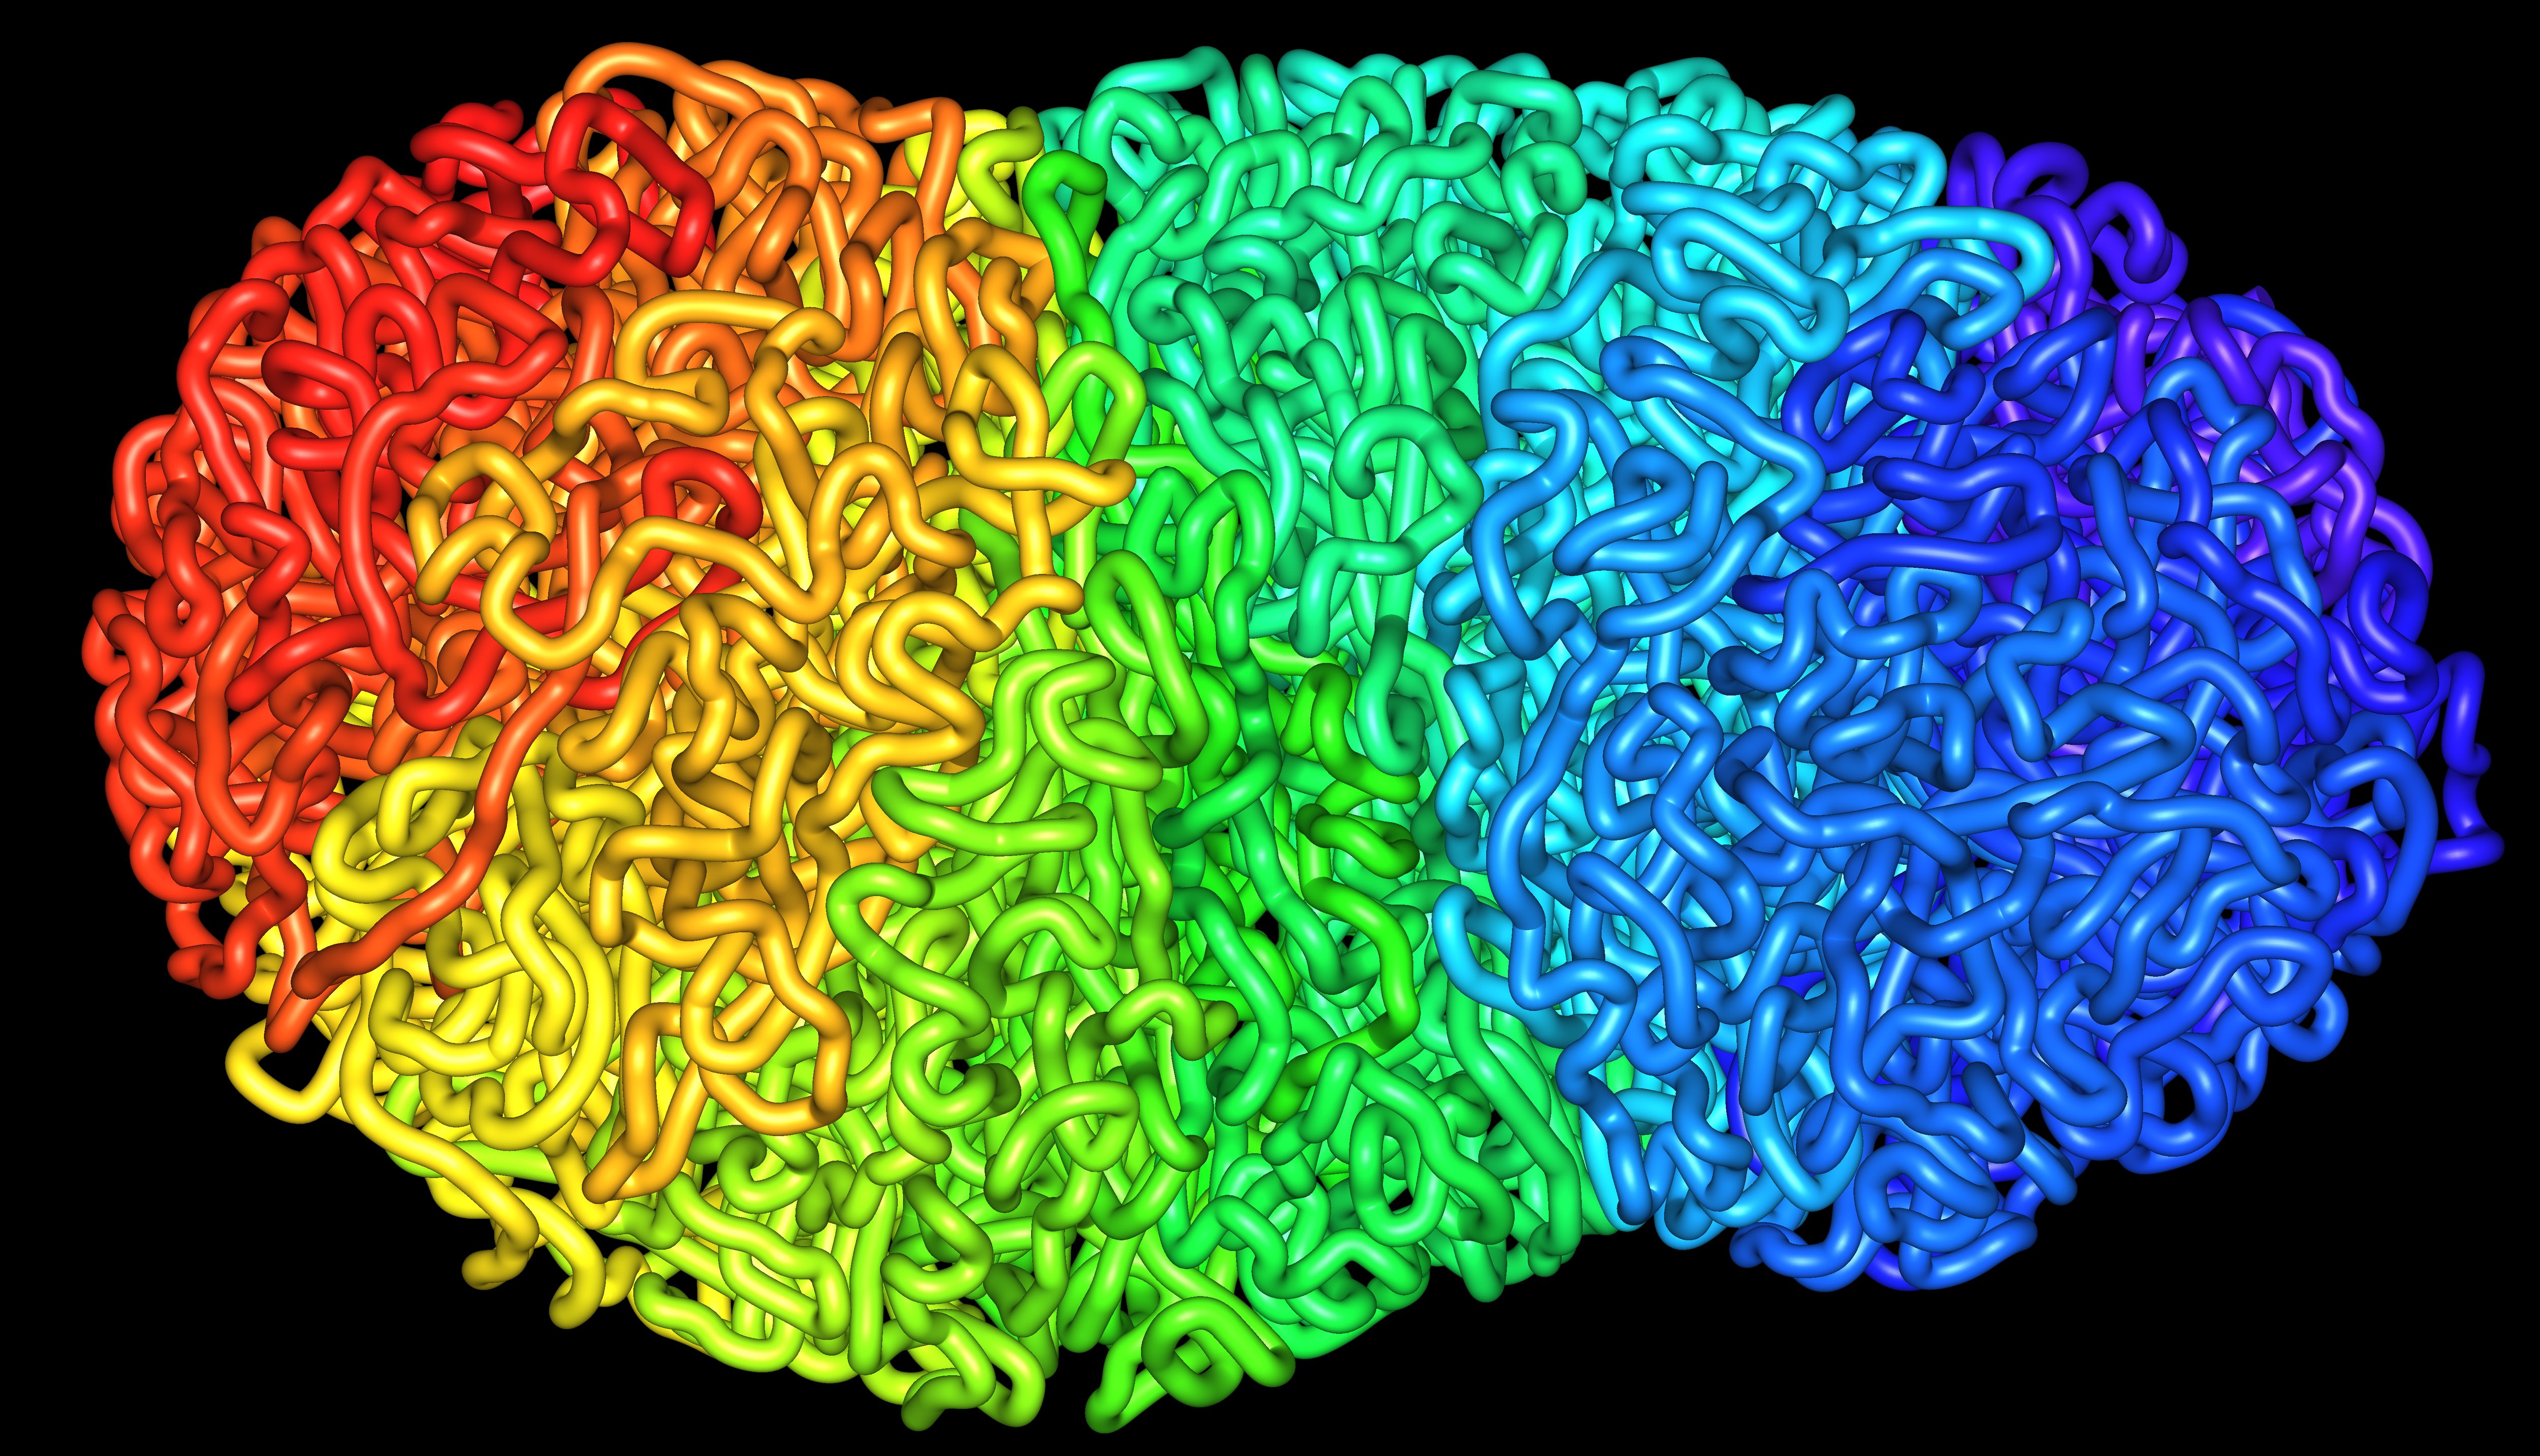
Extrusion Globule 3
Simulation of DNA organized into two globules by loop extrusion. The figure-8 structure indicates the extrusion complex.
Credit: Najeeb Marc Tarazi, Adrian Sanborn, Erez Lieberman Aiden. -
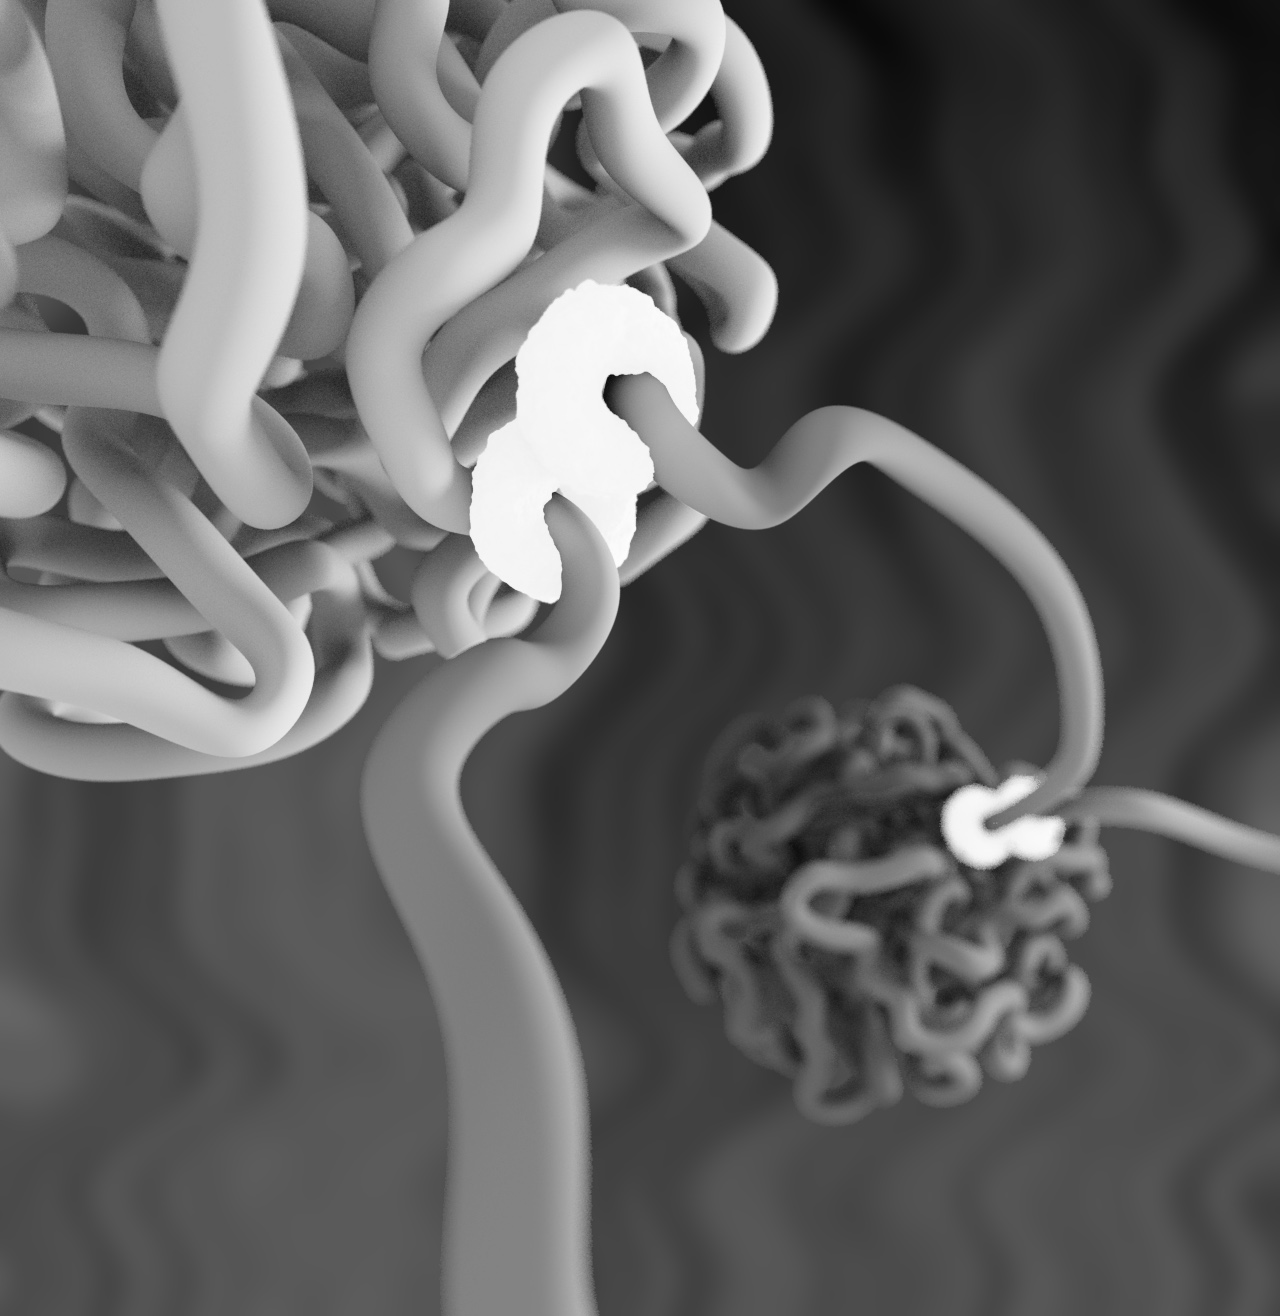
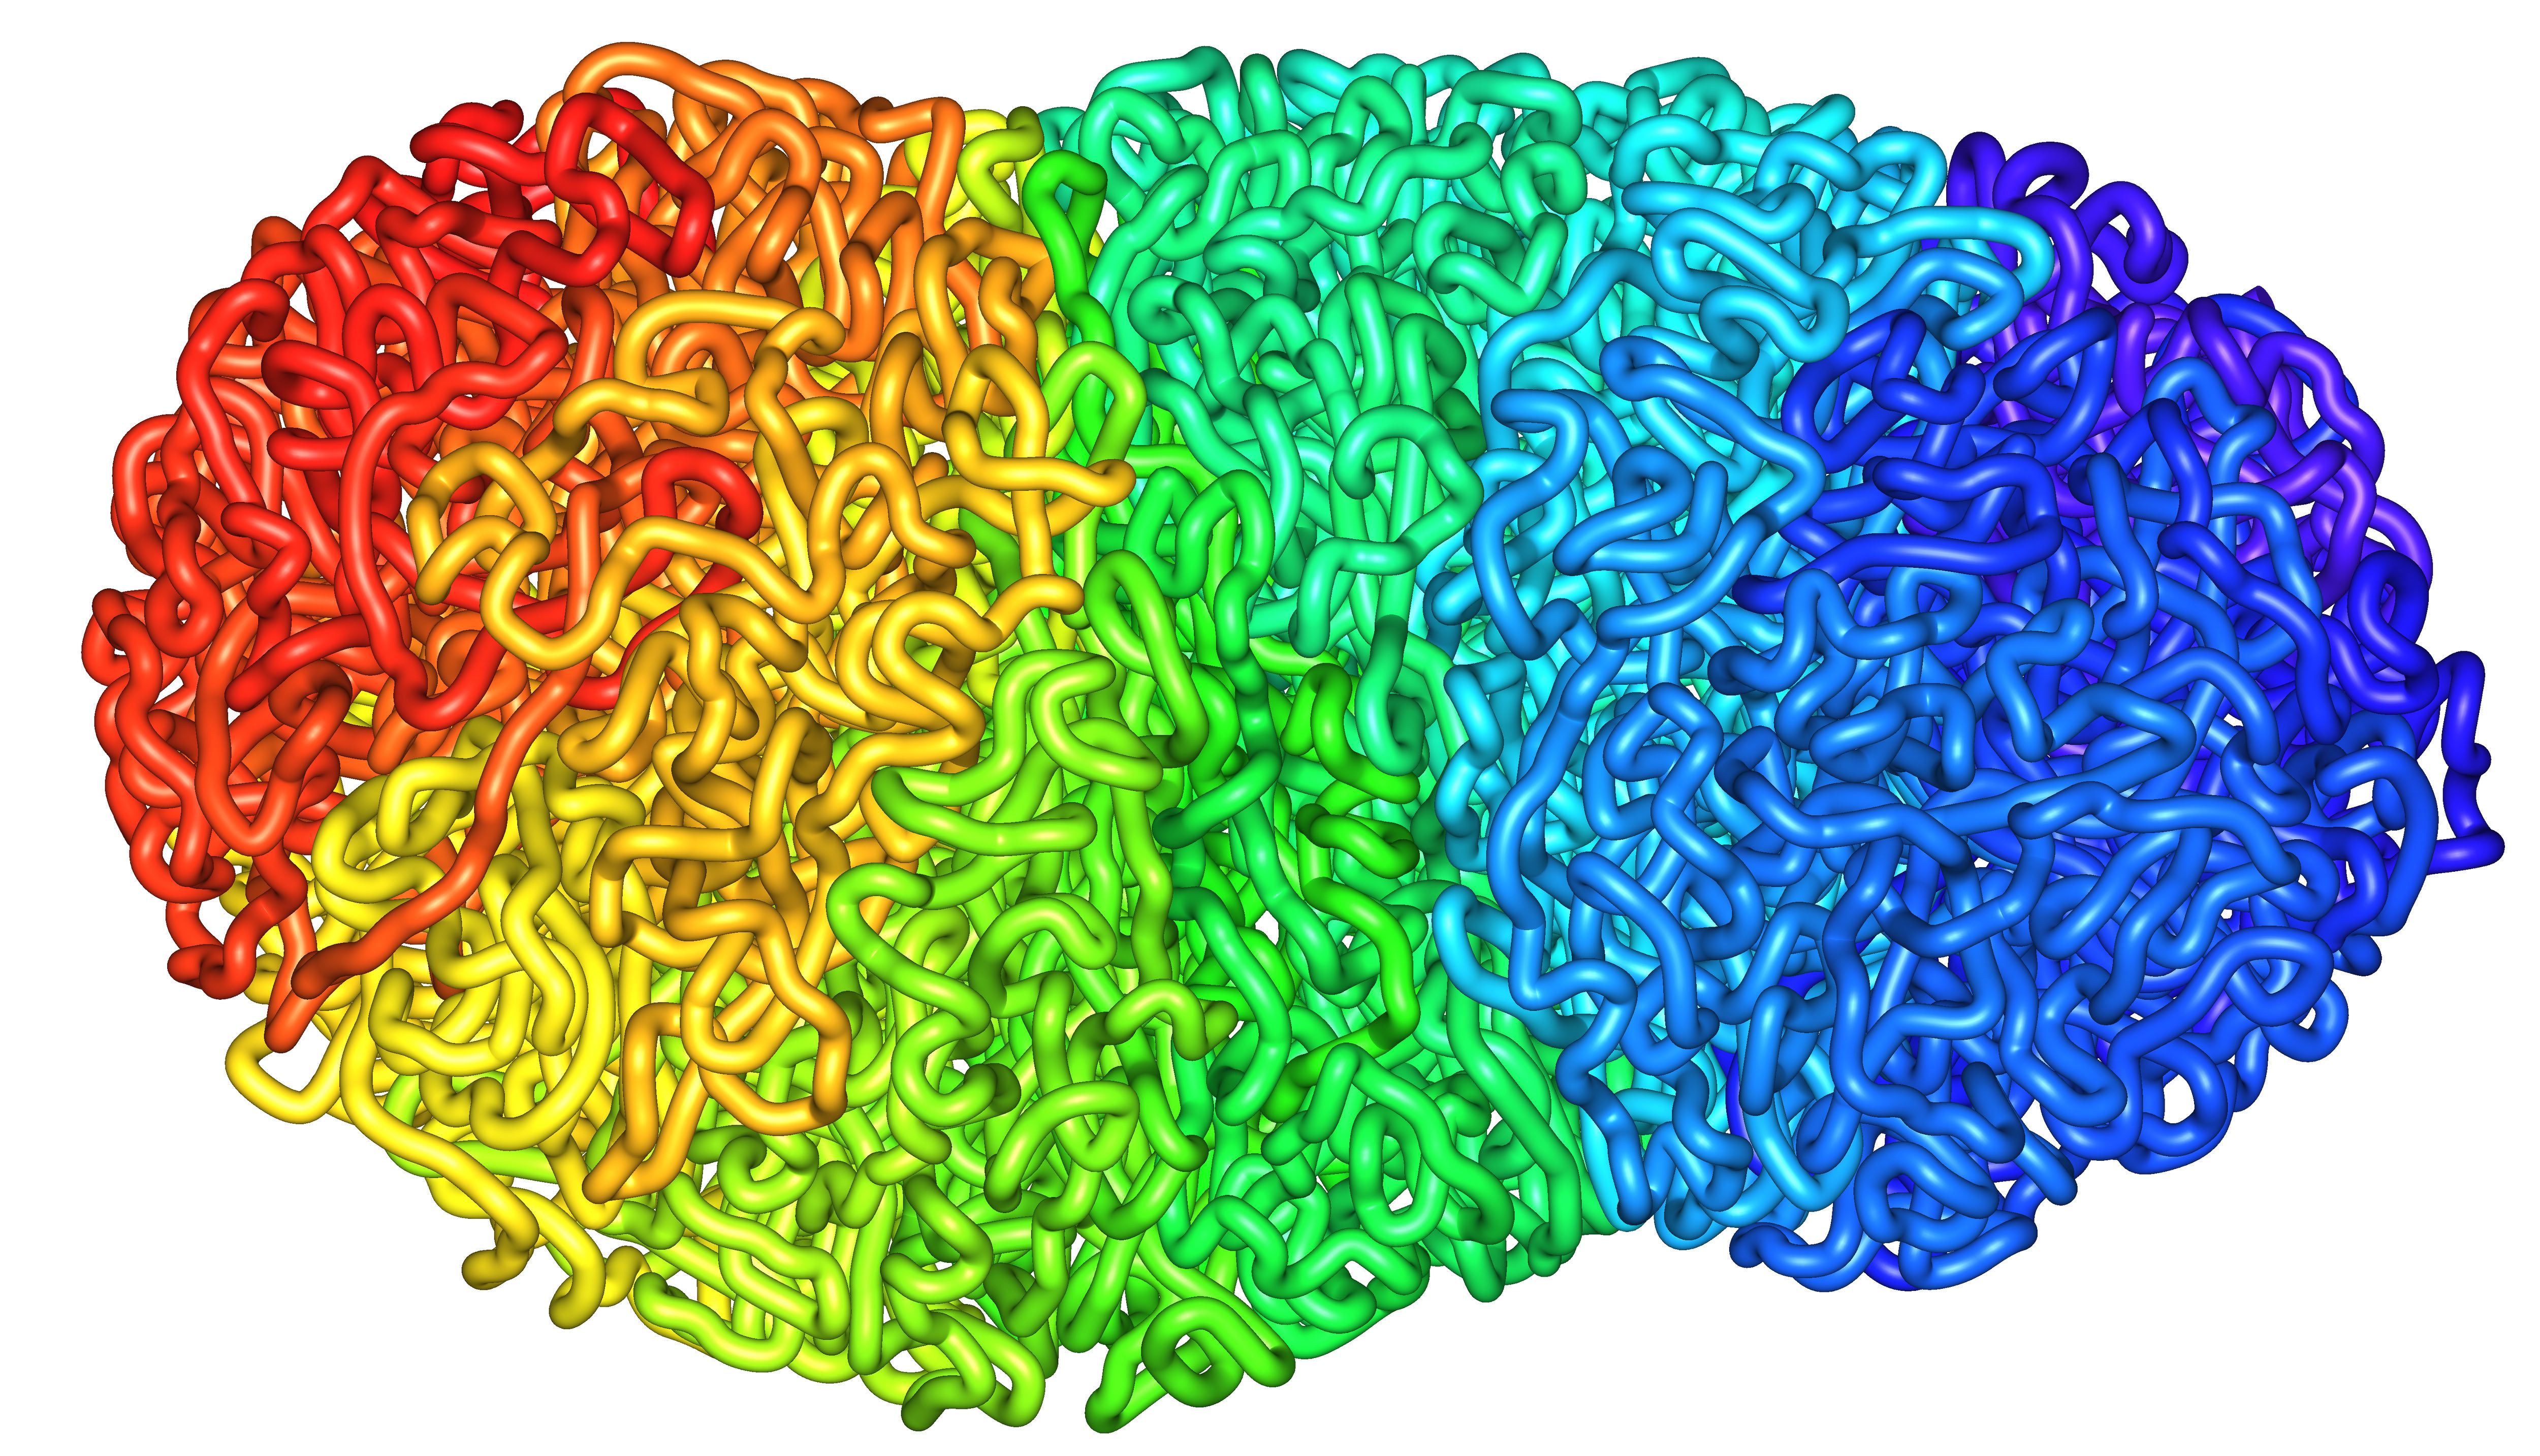
Extrusion Globule 4
Simulation of DNA organized into two globules by loop extrusion. The figure-8 structure indicates the extrusion complex.
Credit: Najeeb Marc Tarazi, Adrian Sanborn, Erez Lieberman Aiden. -
Extrusion Globule 5
Simulation of DNA organized into two globules by loop extrusion. The figure-8 structure indicates the extrusion complex.
Credit: Najeeb Marc Tarazi, Adrian Sanborn, Erez Lieberman Aiden. -
Extrusion Globule 6
Simulation of DNA organized into two globules by loop extrusion. The figure-8 structure indicates the extrusion complex.
Credit: Najeeb Marc Tarazi, Adrian Sanborn, Erez Lieberman Aiden. -

Inside-Out Hilbert Curve, Iteration 4
This new space-filling fractal curve, the Inside-out Hilbert Curve, generalizes a famous 1891 construction due to mathematician David Hilbert. Both the interior and boundary of the curve are fractals.
Credit: Doug McKenna, Adrian Sanborn, Erez Lieberman Aiden. -

Inside-Out Hilbert Curve, Iteration 5
This new space-filling fractal curve, the Inside-out Hilbert Curve, generalizes a famous 1891 construction due to mathematician David Hilbert. Both the interior and boundary of the curve are fractals.
Credit: Doug McKenna, Adrian Sanborn, Erez Lieberman Aiden. -

Inside-Out Hilbert Curve, Progression
This new space-filling fractal curve, the Inside-out Hilbert Curve, generalizes a famous 1891 construction due to mathematician David Hilbert. Both the interior and boundary of the curve are fractals.
Credit: Doug McKenna, Adrian Sanborn, Erez Lieberman Aiden. -
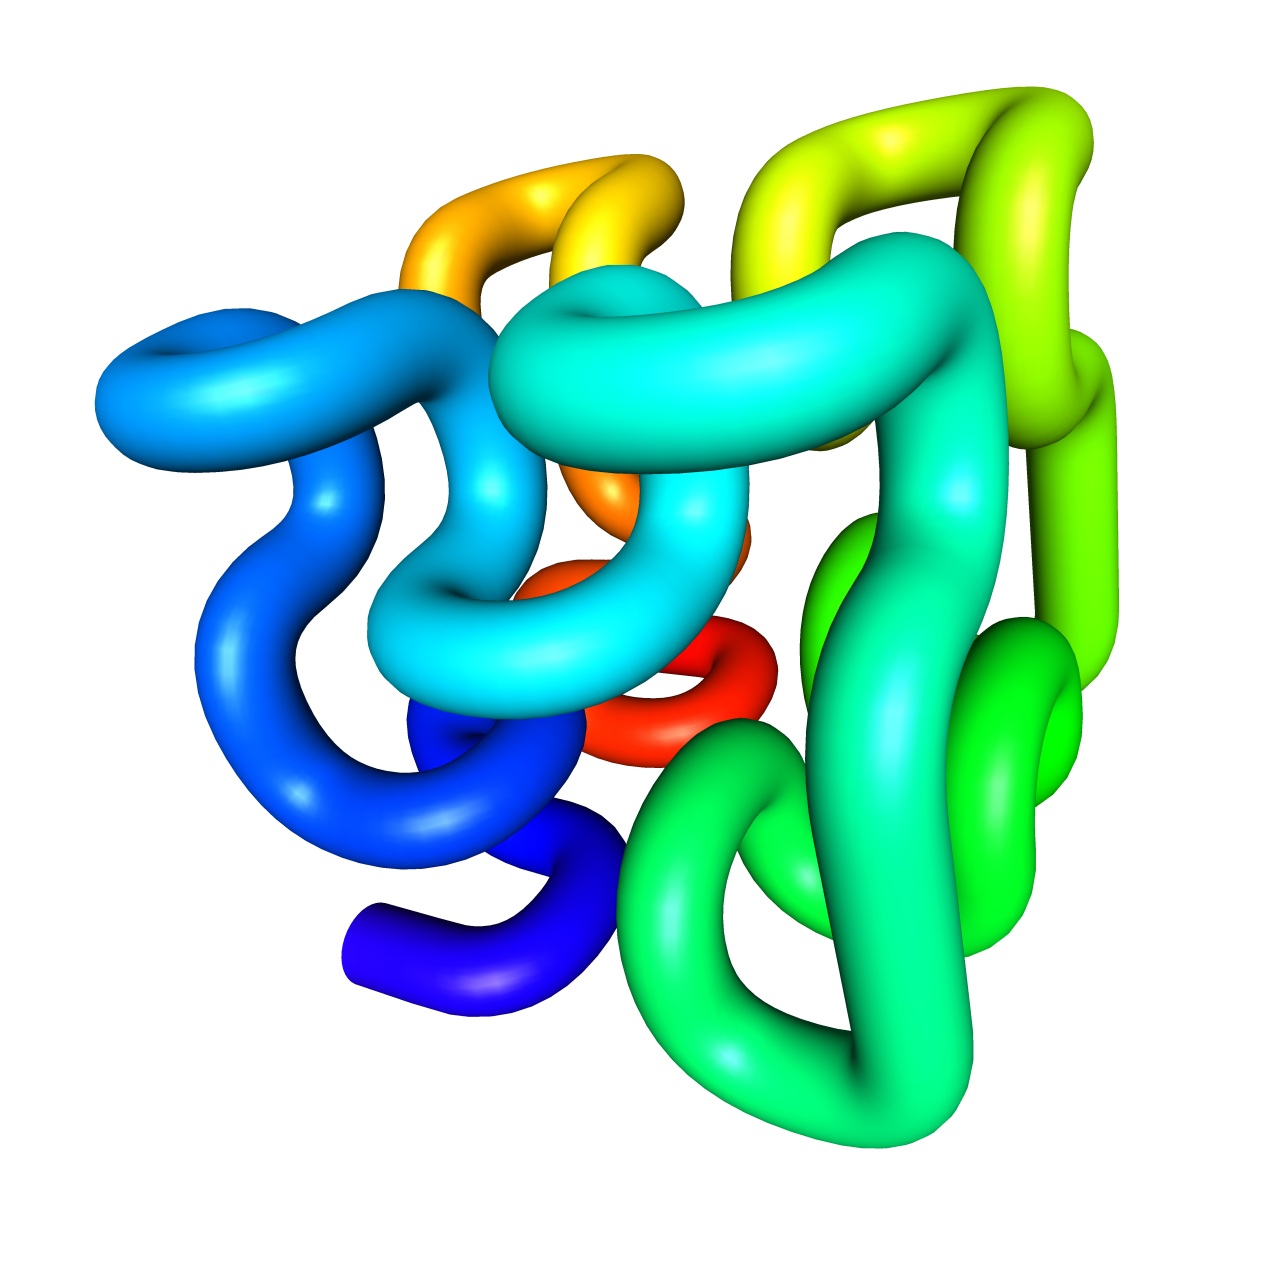
3D Hilbert Curve
Discovered by Giuseppe Peano in 1890, Peano curves are one dimensional curves that densely fill higher dimensional space. Our group's earlier work suggested that long stretches of DNA fold into Peano curve-like fractals. Shown is a particular Peano curve first described by famed mathematician David Hilbert in 1891.
Credit: Miriam Huntley, Jian Li, Rob Scharein, and Erez Lieberman Aiden. -
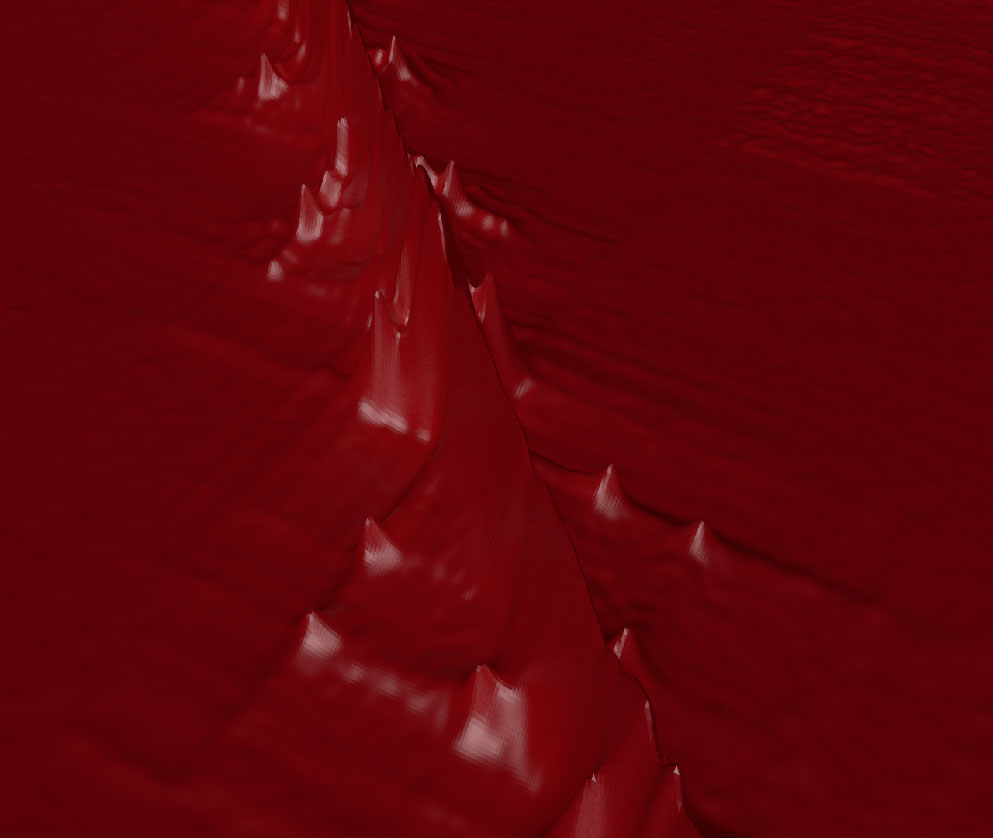
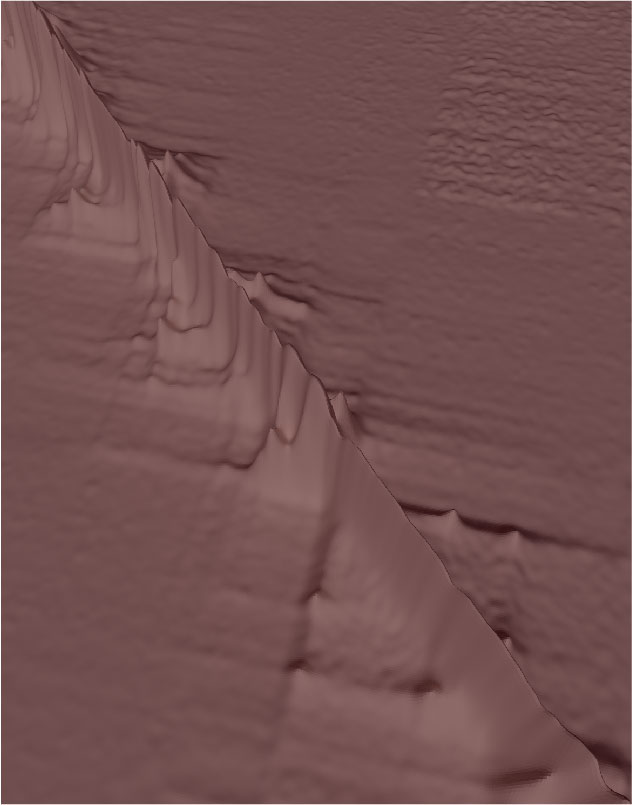
3D Contact Map 1
The Hi-C method measures how frequently two loci in the genome make physical contact in the nucleus of the cell. Here, a Hi-C contact map rendered as a three-dimensional surface. Strong proximity between nearby genomic loci creates a 'wall' bisecting the landscape. Peaks in the contact map correspond to loops in the genome.
Credit: Ido Machol, Erez Lieberman Aiden. Rendered by Ido Machol. -
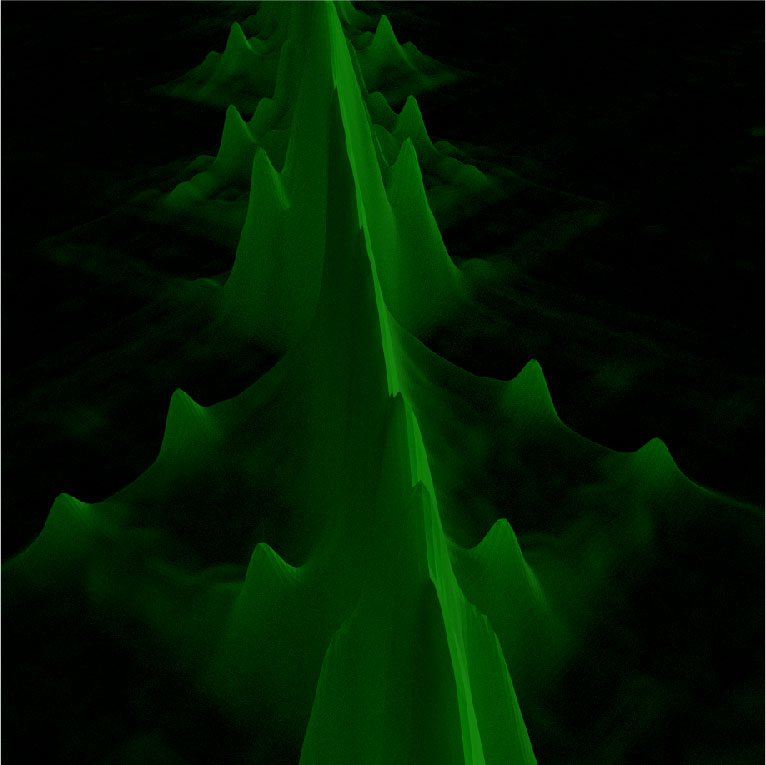
3D Contact Map 2
The Hi-C method measures how frequently two loci in the genome make physical contact in the nucleus of the cell. Here, a Hi-C contact map rendered as a three-dimensional surface. Strong proximity between nearby genomic loci creates a 'wall' bisecting the landscape. Peaks in the contact map correspond to loops in the genome.
Credit: Ido Machol, Erez Lieberman Aiden. Rendered by Ido Machol. -
3D Contact Map 3
The Hi-C method measures how frequently two loci in the genome make physical contact in the nucleus of the cell. Here, a Hi-C contact map rendered as a three-dimensional surface. Strong proximity between nearby genomic loci creates a 'wall' bisecting the landscape. Peaks in the contact map correspond to loops in the genome.
Credit: Ido Machol, Erez Lieberman Aiden. Rendered by Ido Machol. -
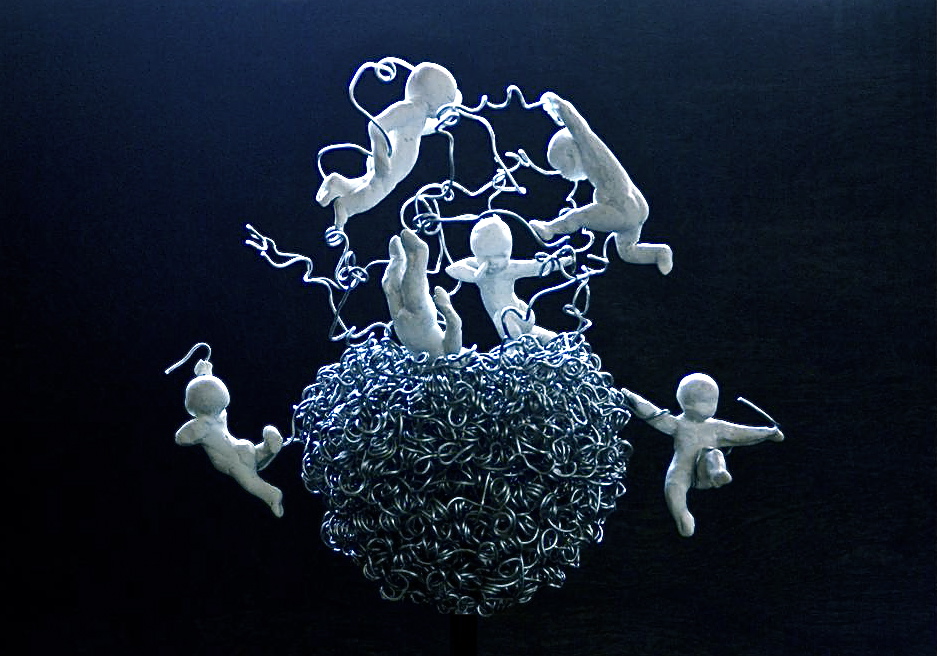
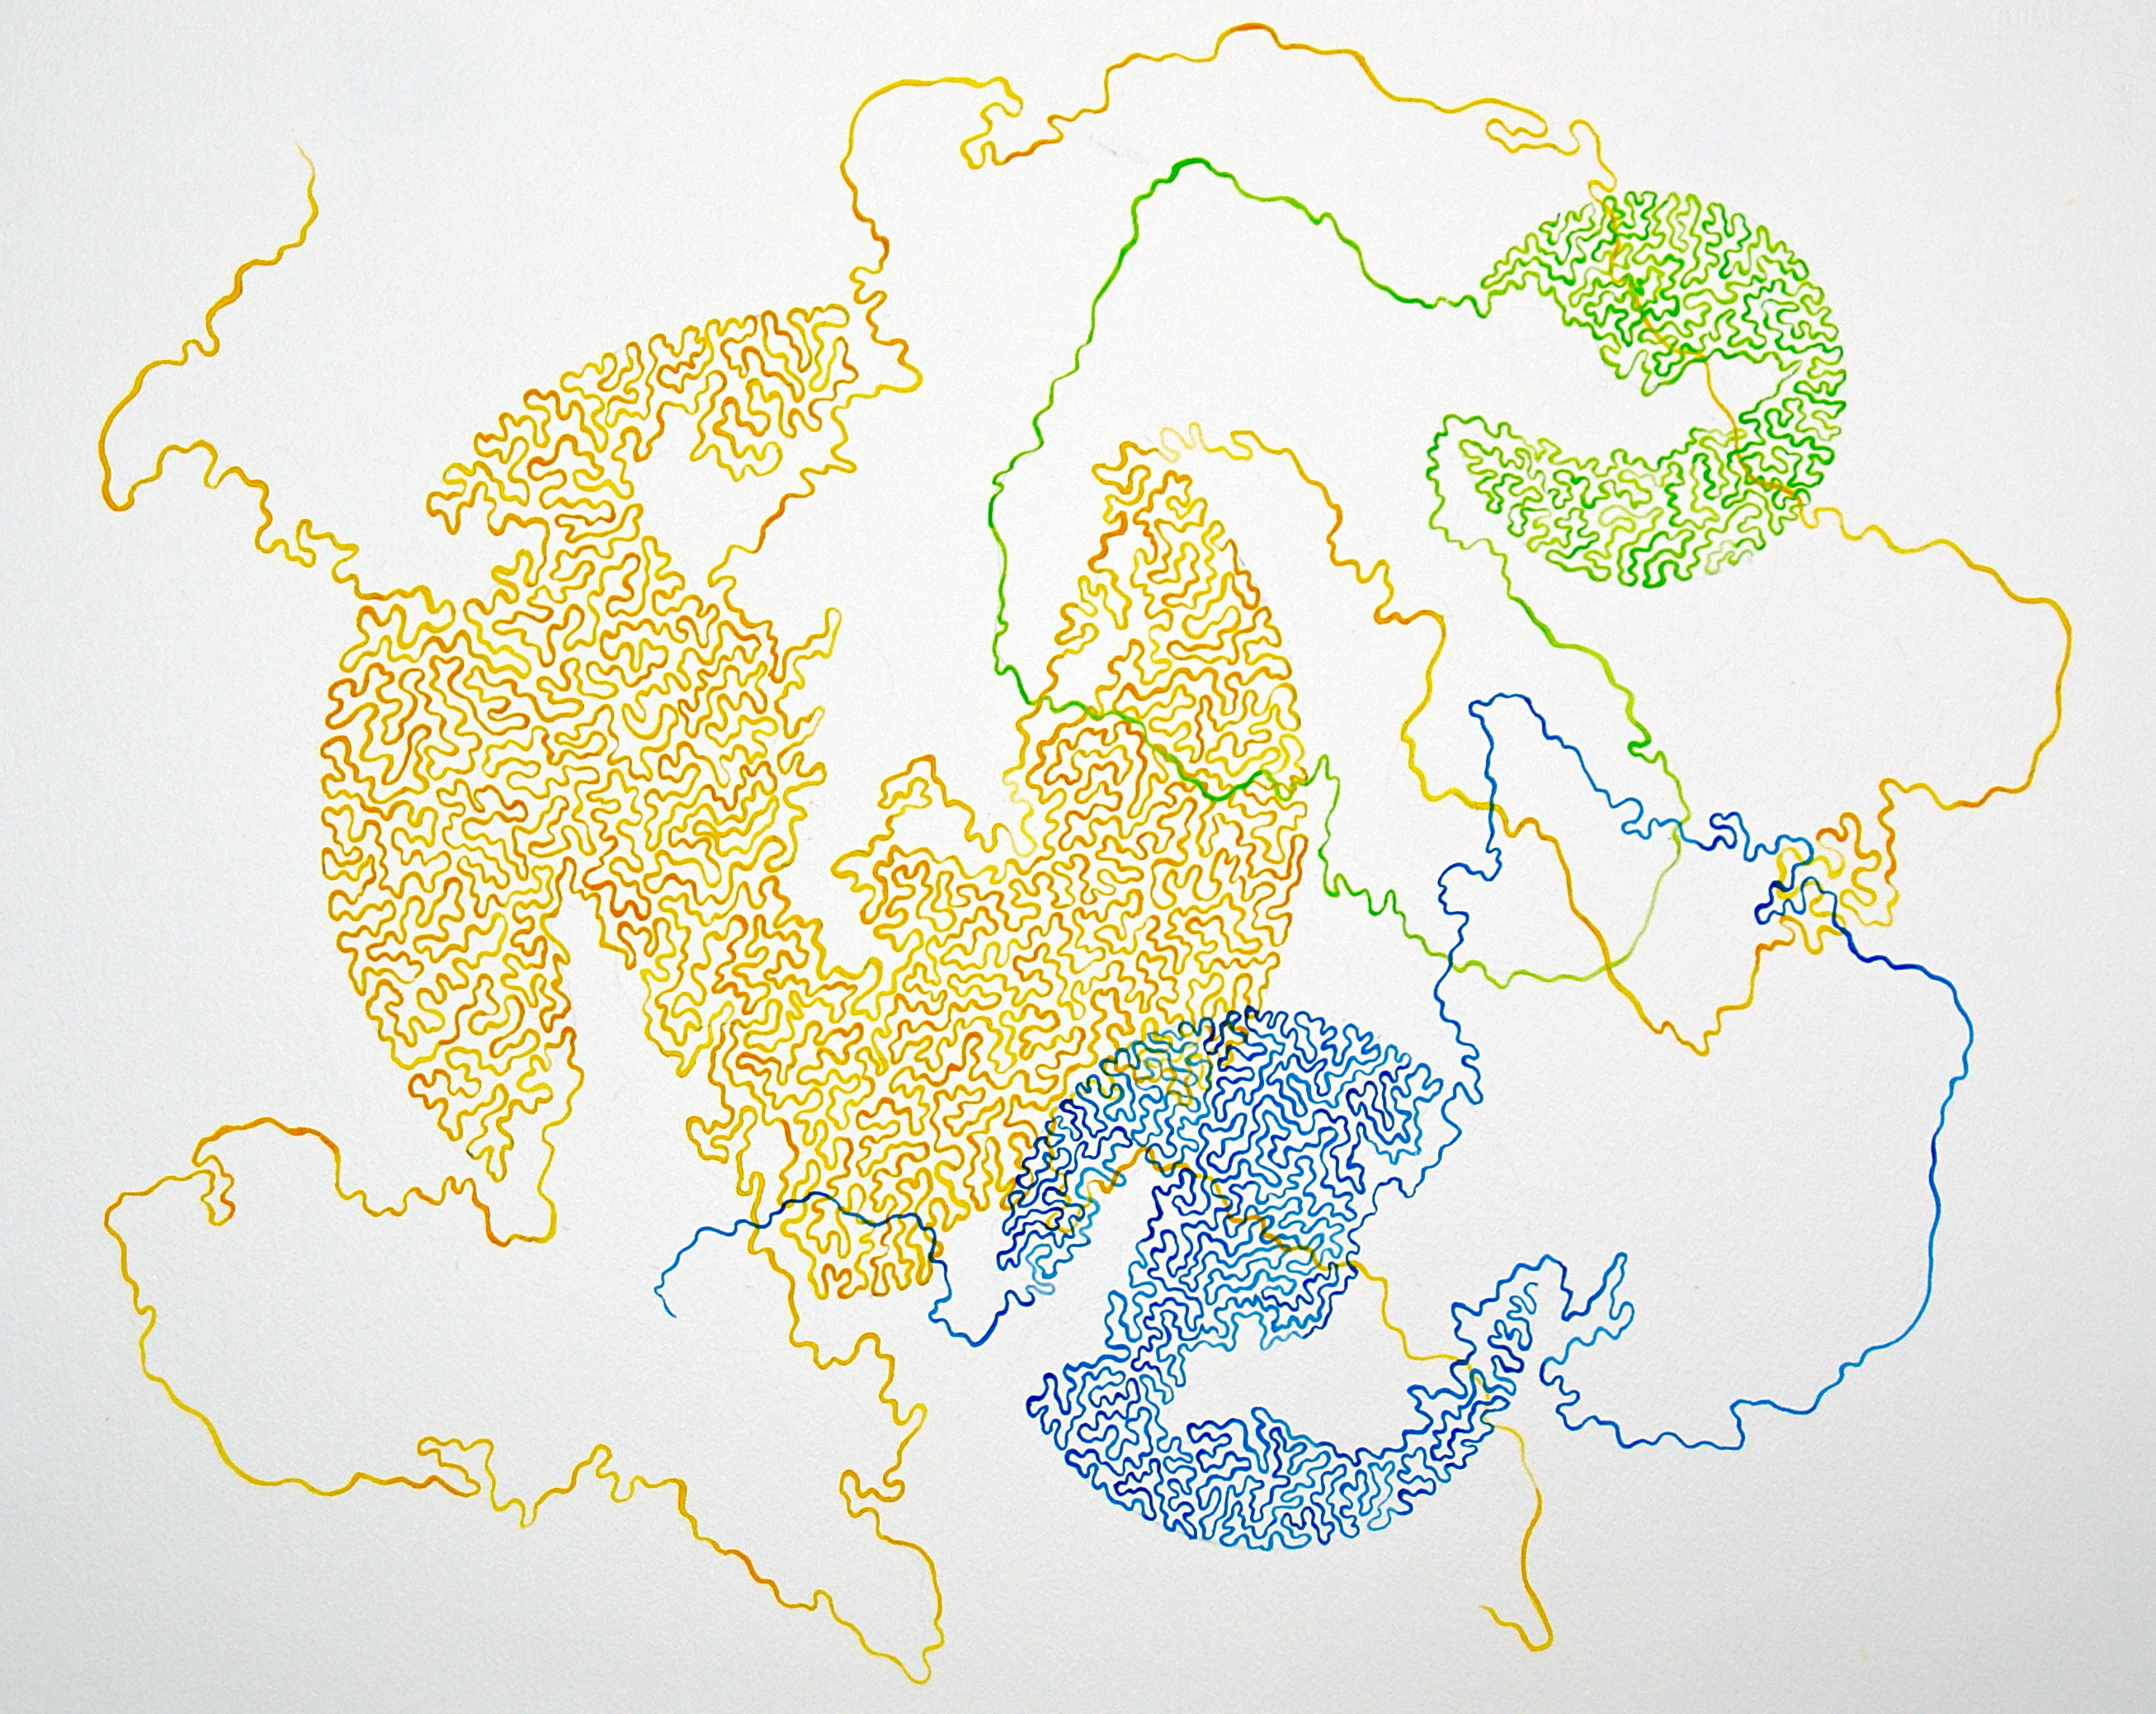
Artist's Interpretation, Mary Ellen Scherl 1
An artist's interpretation of chromatin folded up inside the nucleus. A DNA globule is sculpted with long metal wire. Cherubs called "putti" dance around, unfold, and dive into the DNA.
Credit: Mary Ellen Scherl. -
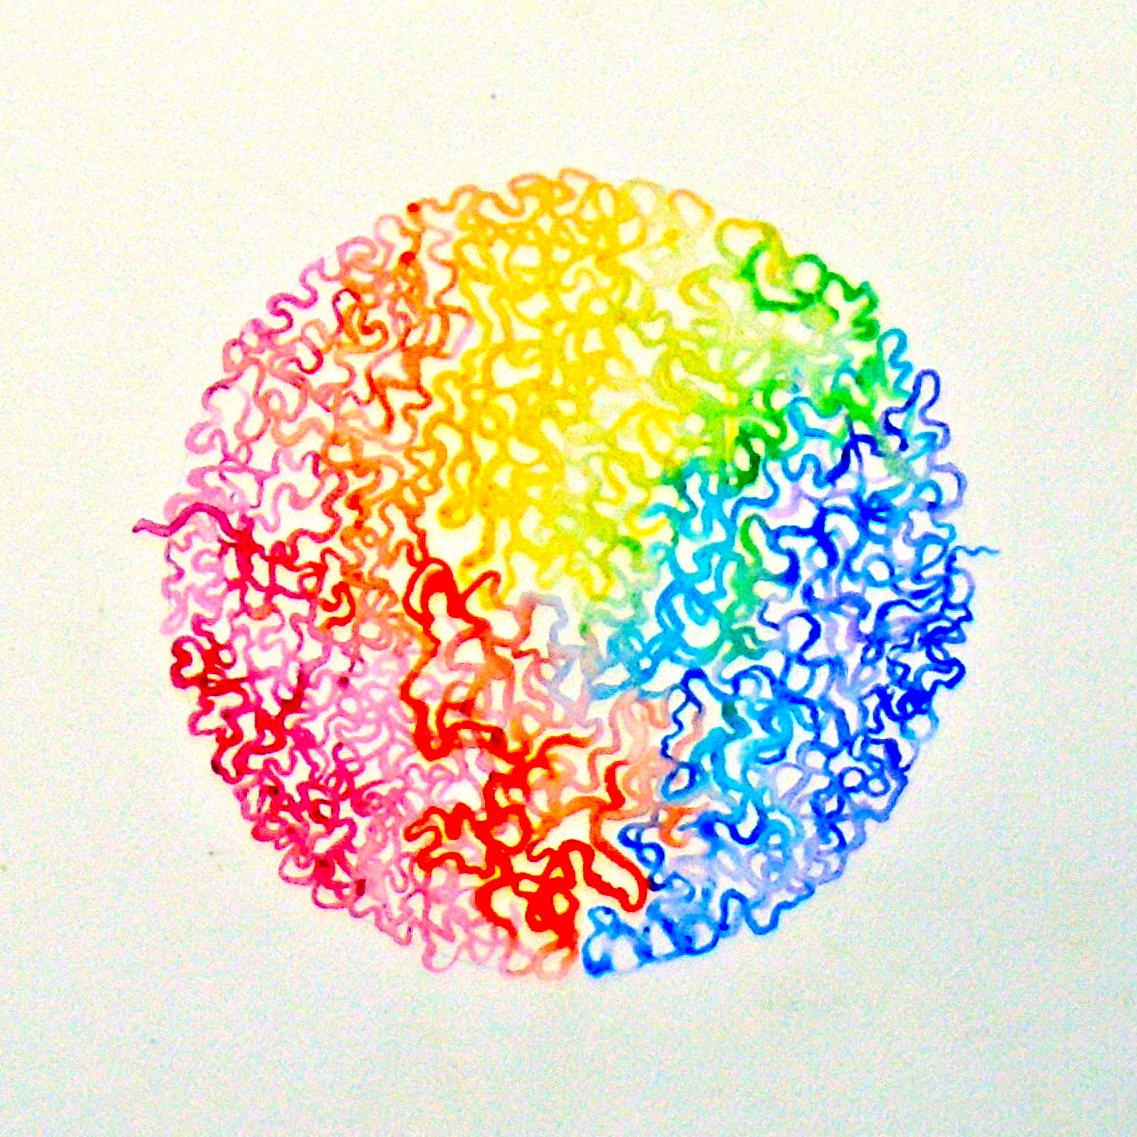
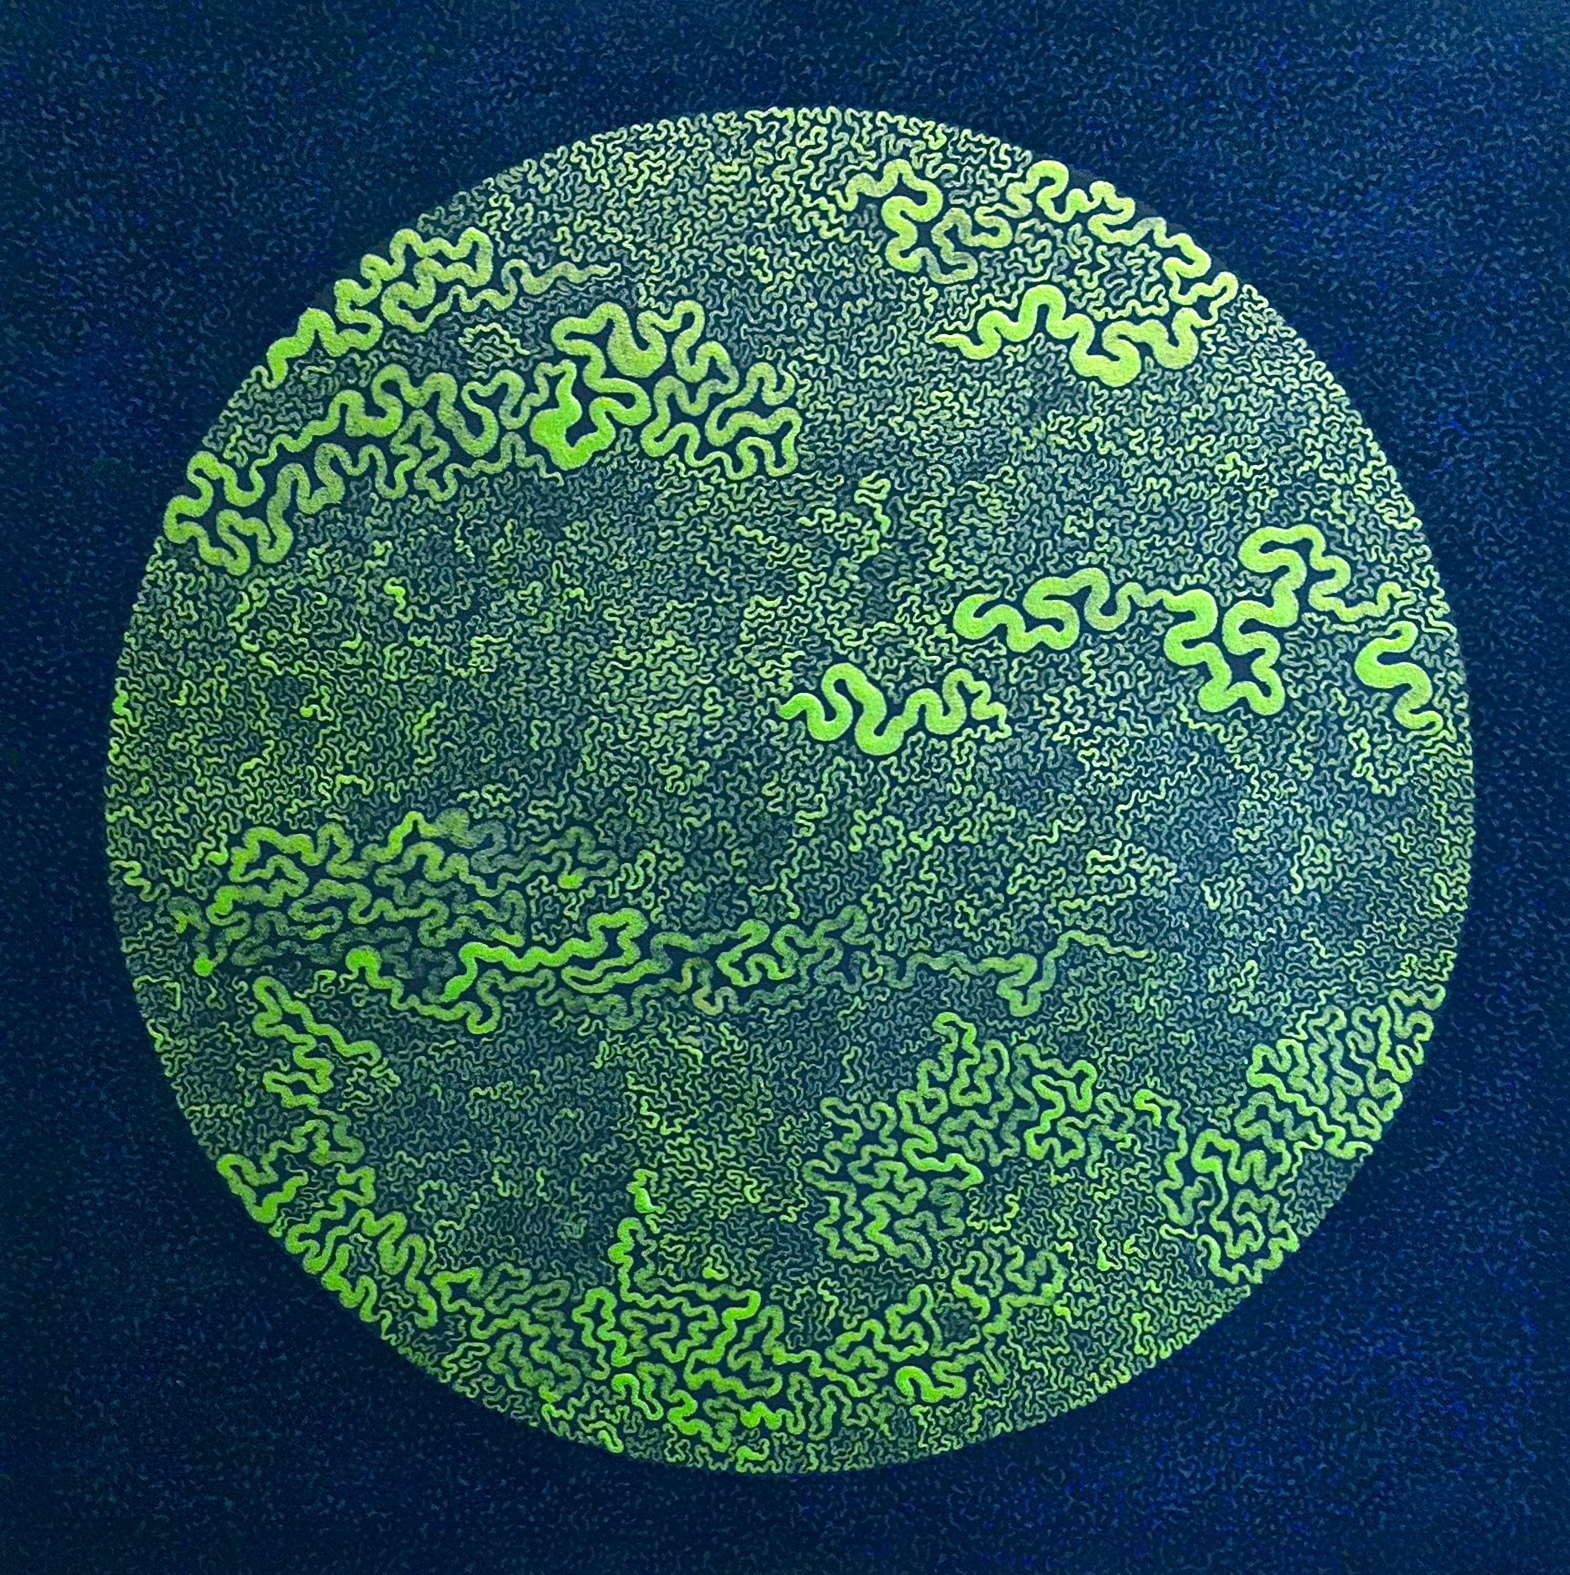
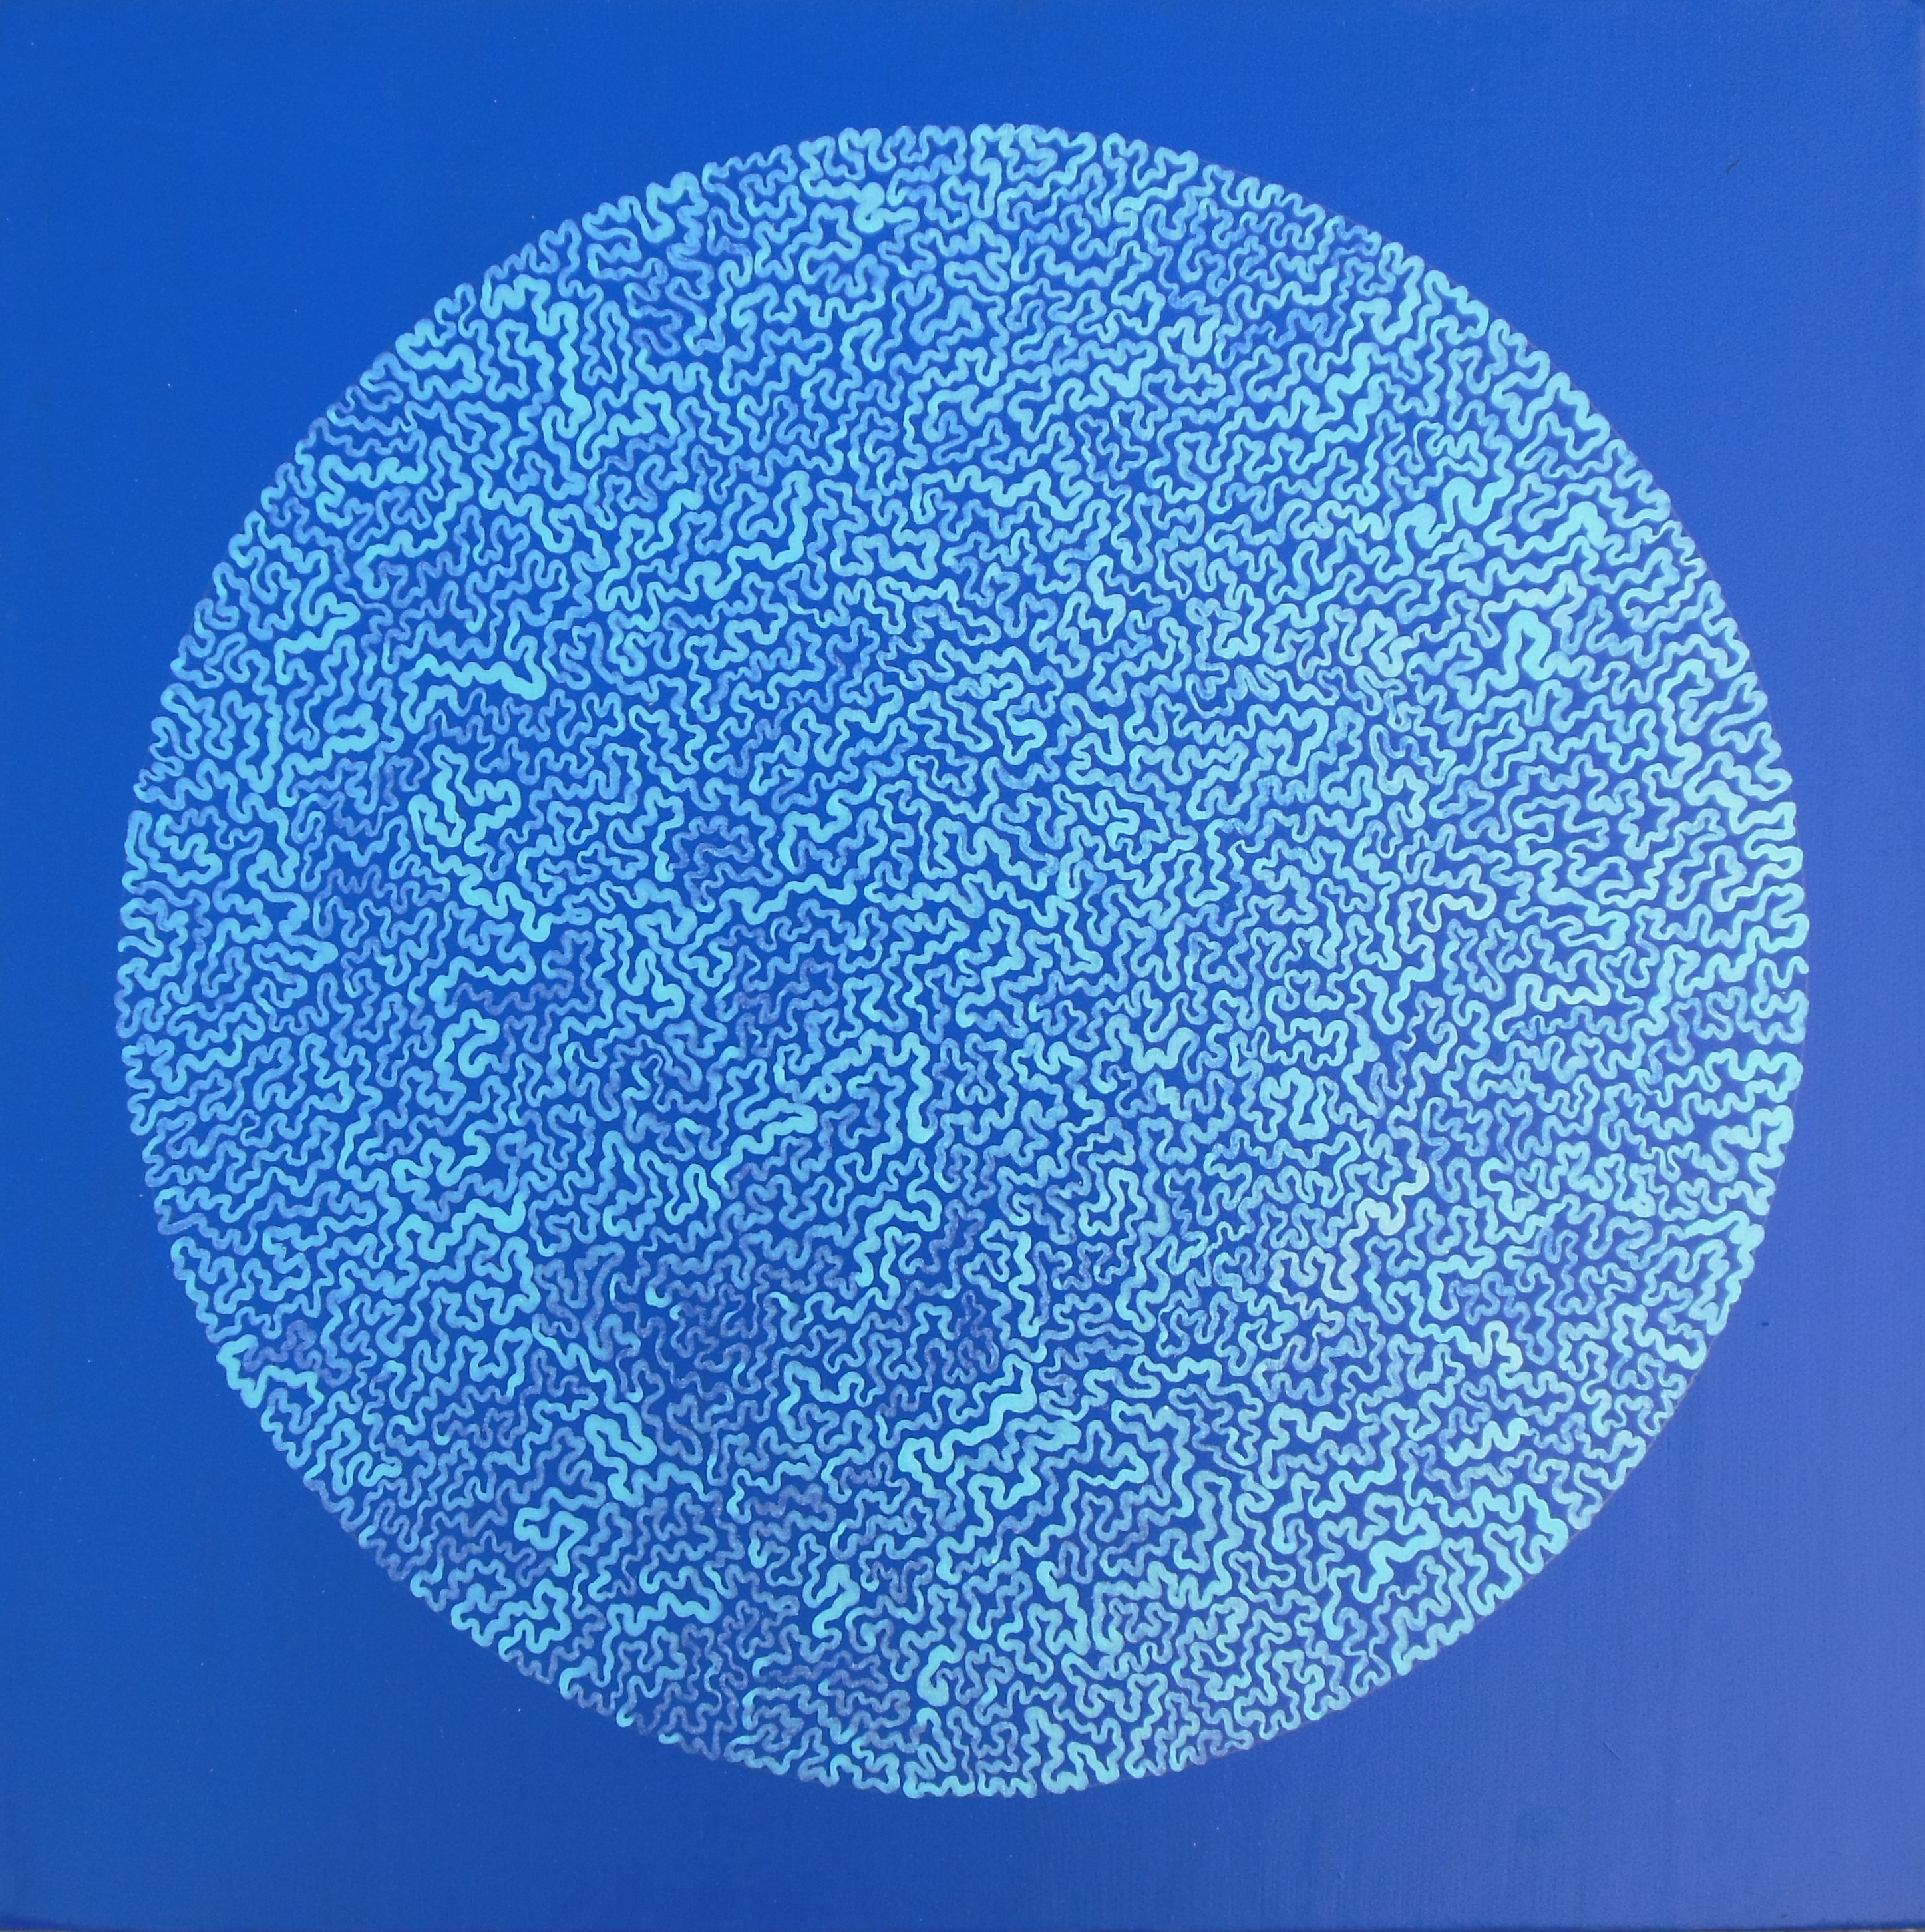
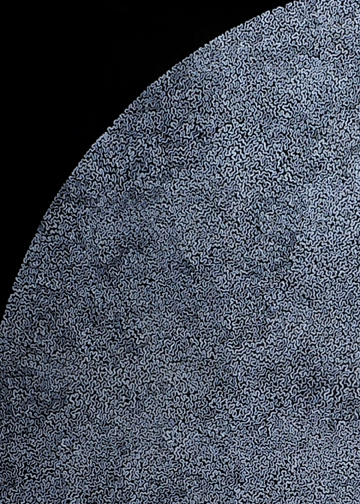
Artist's Interpretation, Mary Ellen Scherl 2
An artist's interpretation of chromatin folded up inside the nucleus. The artist has rendered an extraordinarly long contour into a small area, in two dimensions, by hand.
Credit: Mary Ellen Scherl. -
Artist's Interpretation, Mary Ellen Scherl 3
An artist's interpretation of chromatin folded up inside the nucleus. The artist has rendered an extraordinarly long contour into a small area, in two dimensions, by hand.
Credit: Mary Ellen Scherl. -
Artist's Interpretation, Mary Ellen Scherl 4
An artist's interpretation of chromatin folded up inside the nucleus. The artist has rendered an extraordinarly long contour into a small area, in two dimensions, by hand.
Credit: Mary Ellen Scherl. -
Artist's Interpretation, Mary Ellen Scherl 5
An artist's interpretation of chromatin folded up inside the nucleus. The artist has rendered an extraordinarly long contour into a small area, in two dimensions, by hand.
Credit: Mary Ellen Scherl. -
Artist's Interpretation, Mary Ellen Scherl 6
An artist's interpretation of chromatin folded up inside the nucleus. The artist has rendered an extraordinarly long contour into a small area, in two dimensions, by hand.
Credit: Mary Ellen Scherl. -
Artist's Interpretation, Mary Ellen Scherl 7
An artist's interpretation of chromatin folded up inside the nucleus. The artist has rendered an extraordinarly long contour into a small area, in two dimensions, by hand.
Credit: Mary Ellen Scherl. -
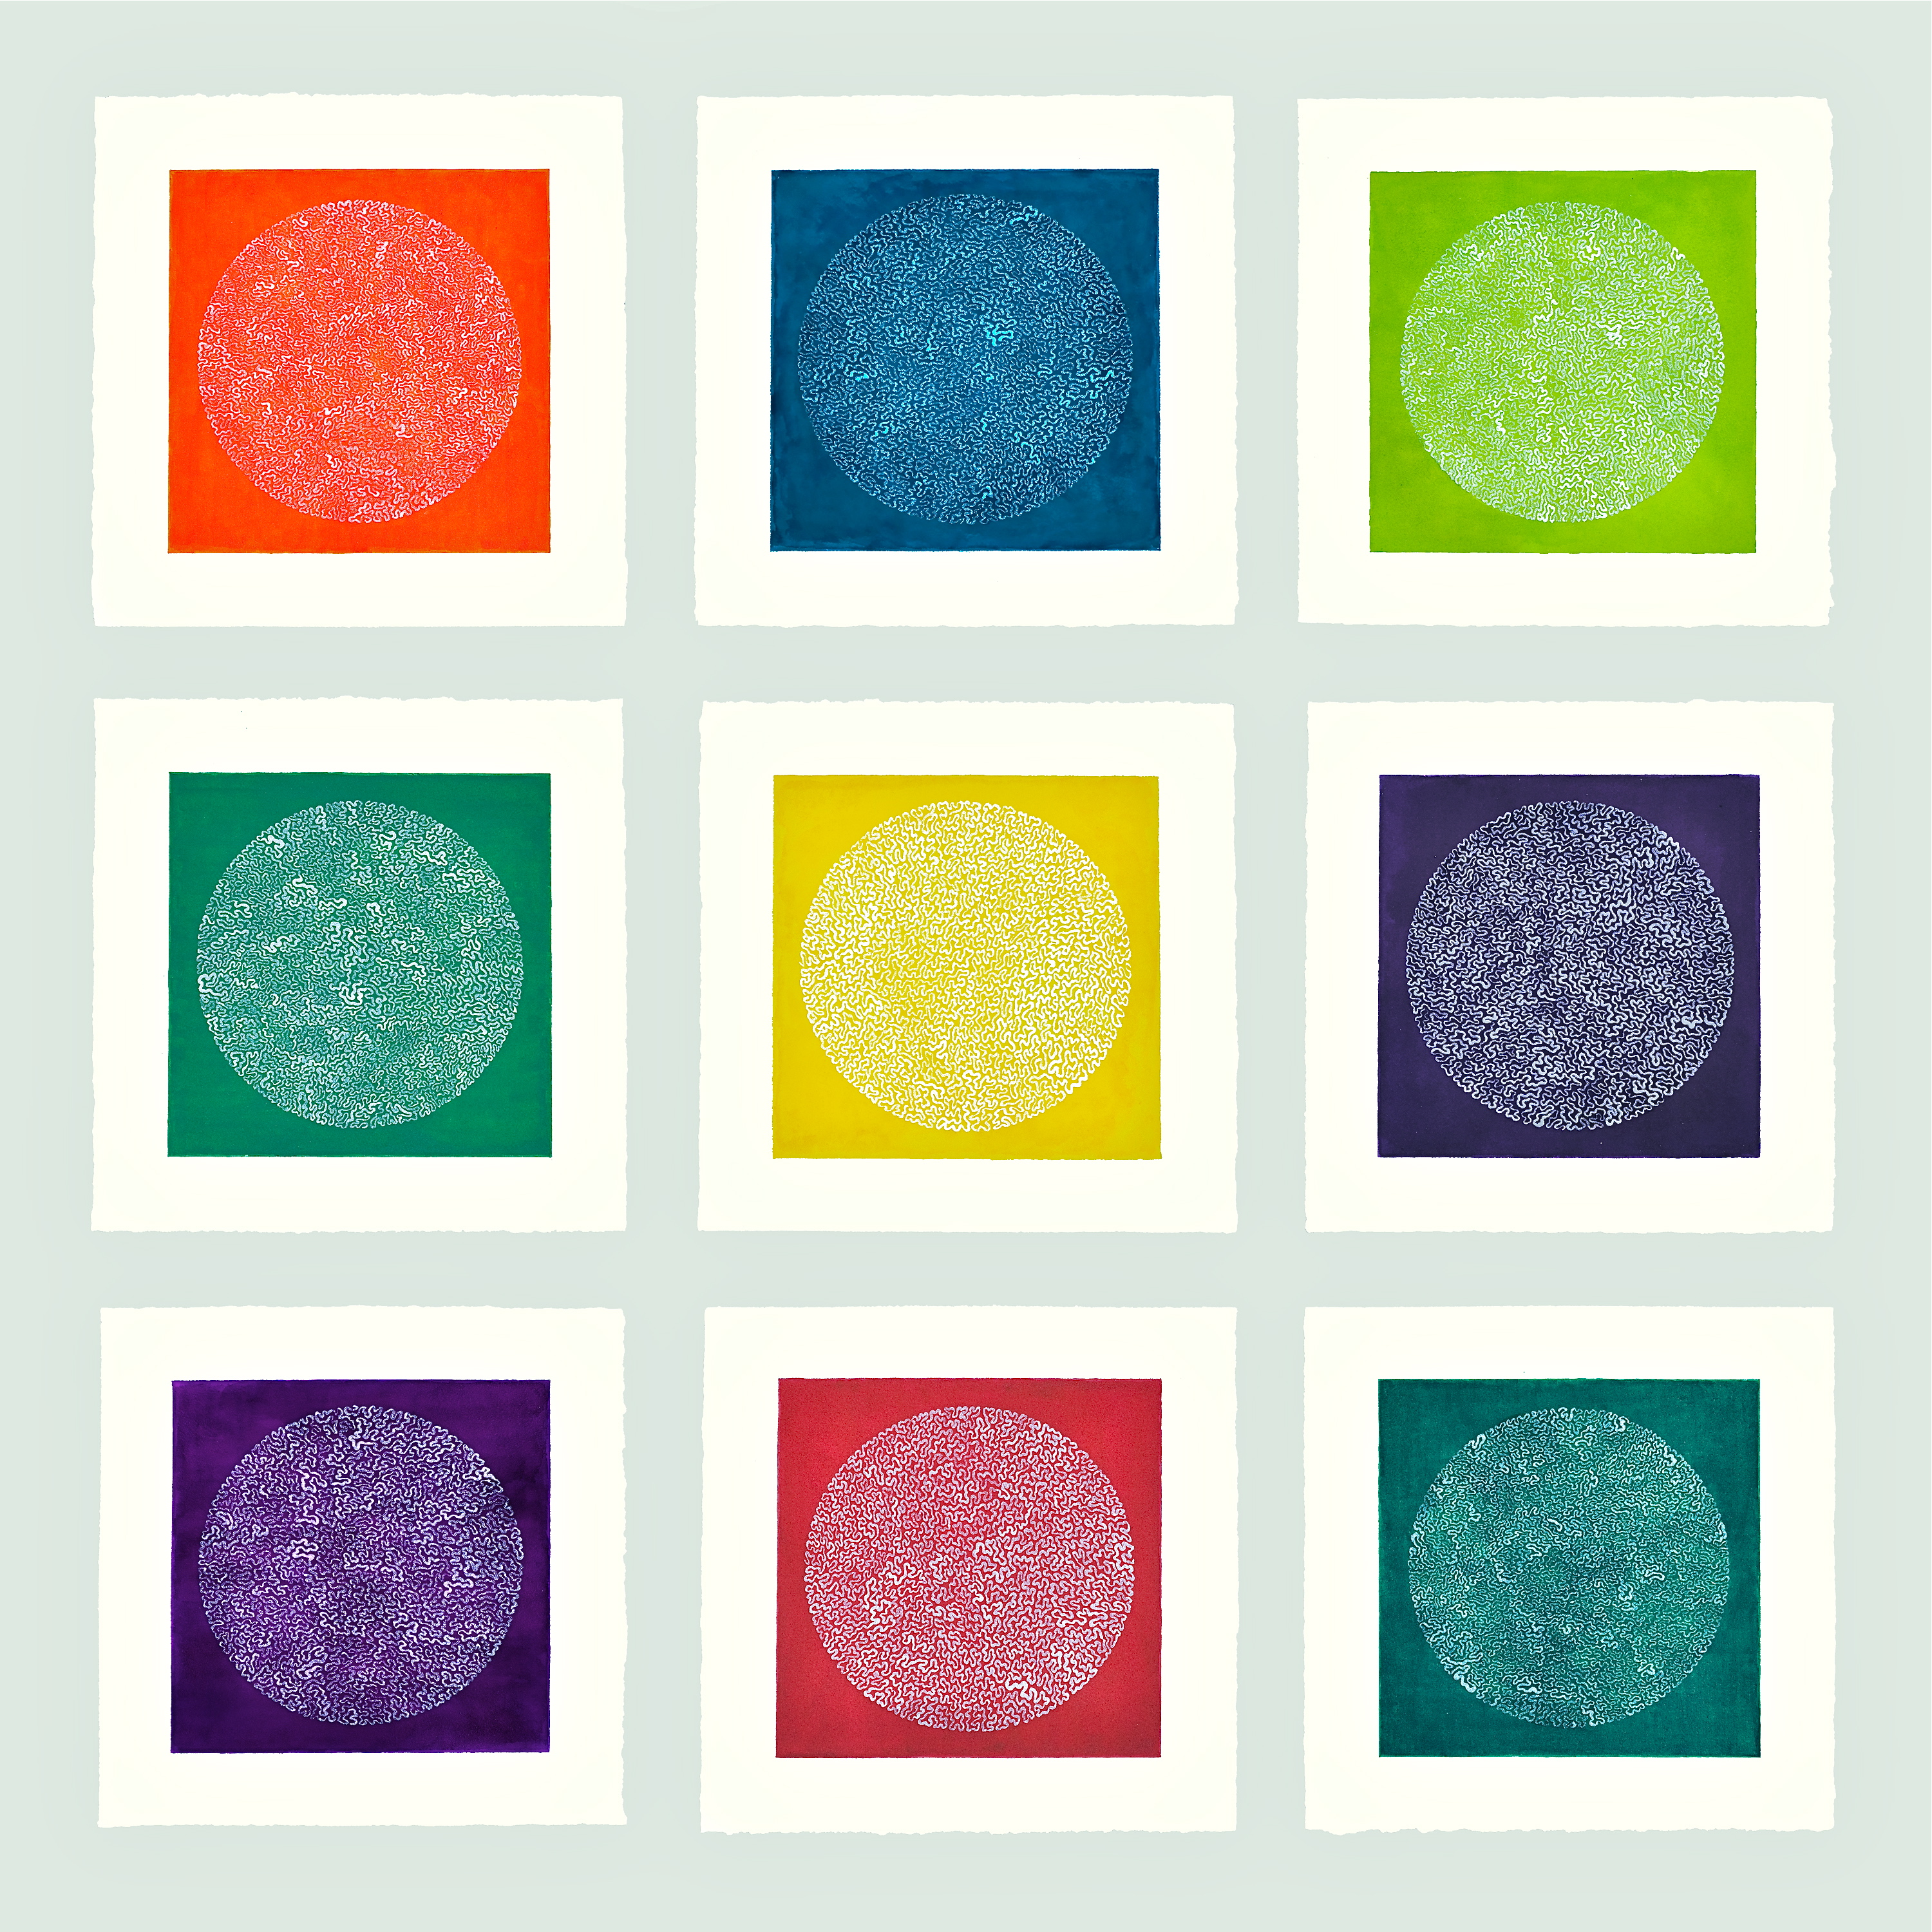
Artist's Interpretation, Guhapriya Ranganathan 1
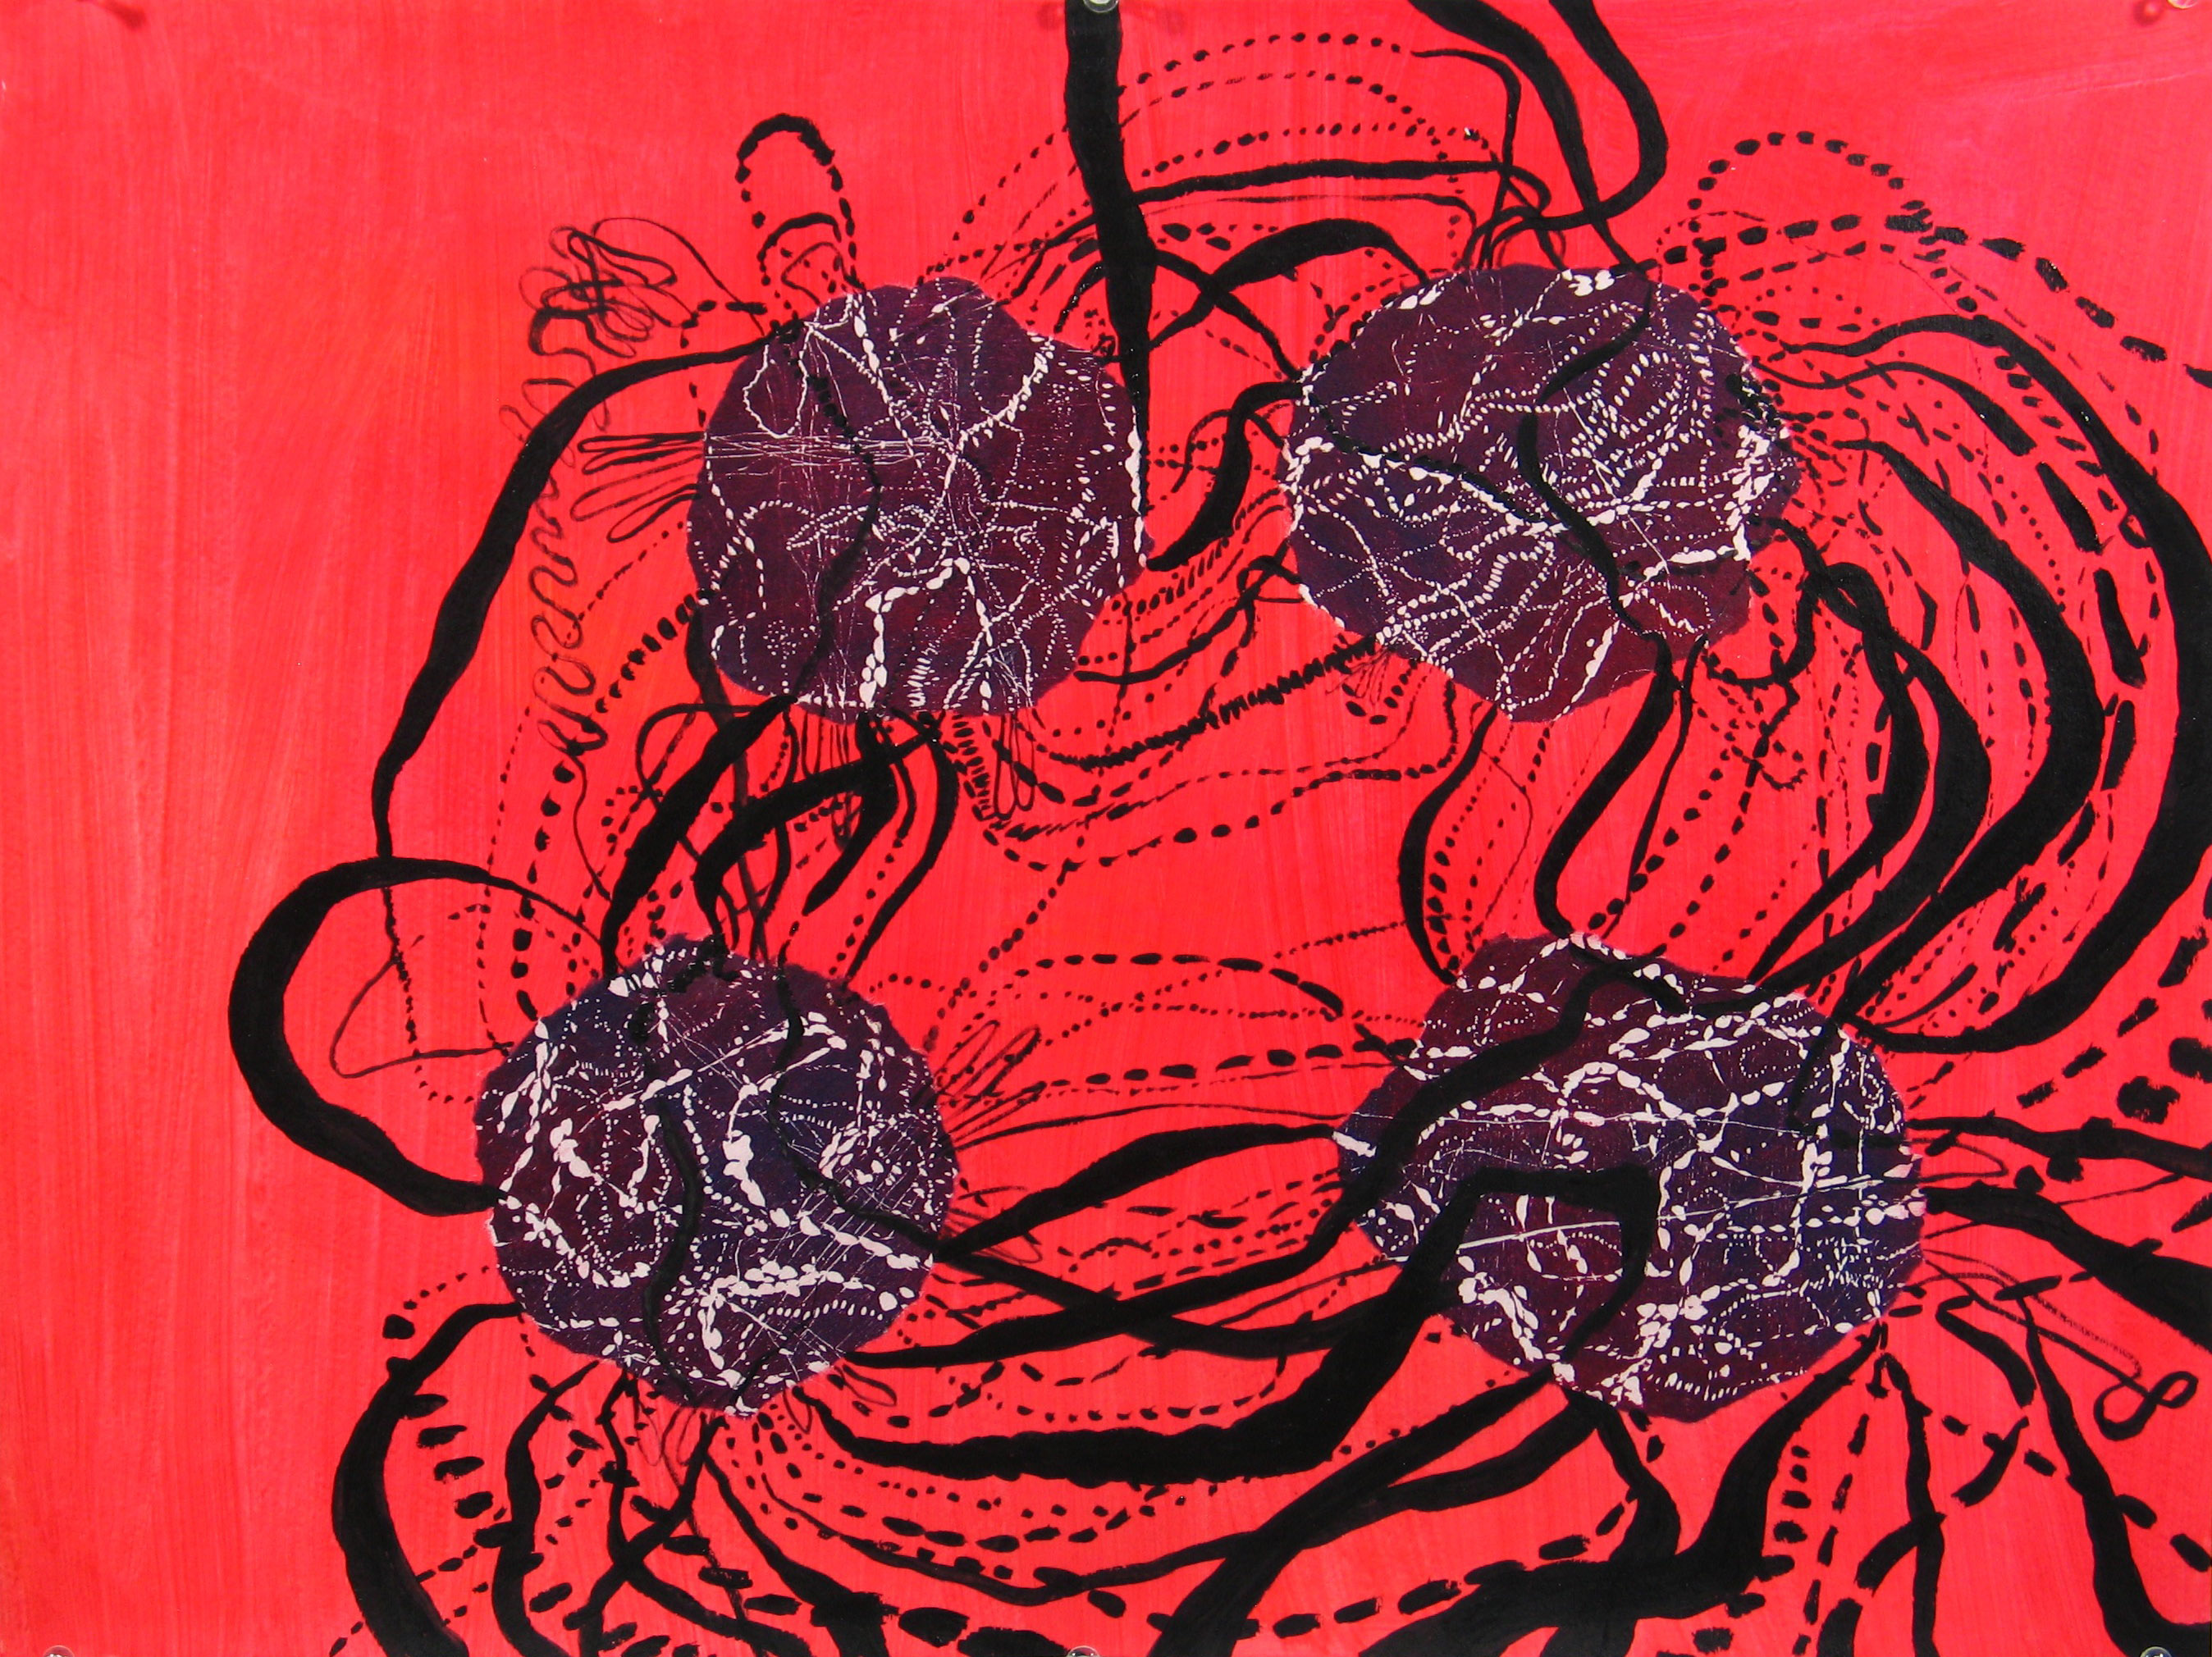
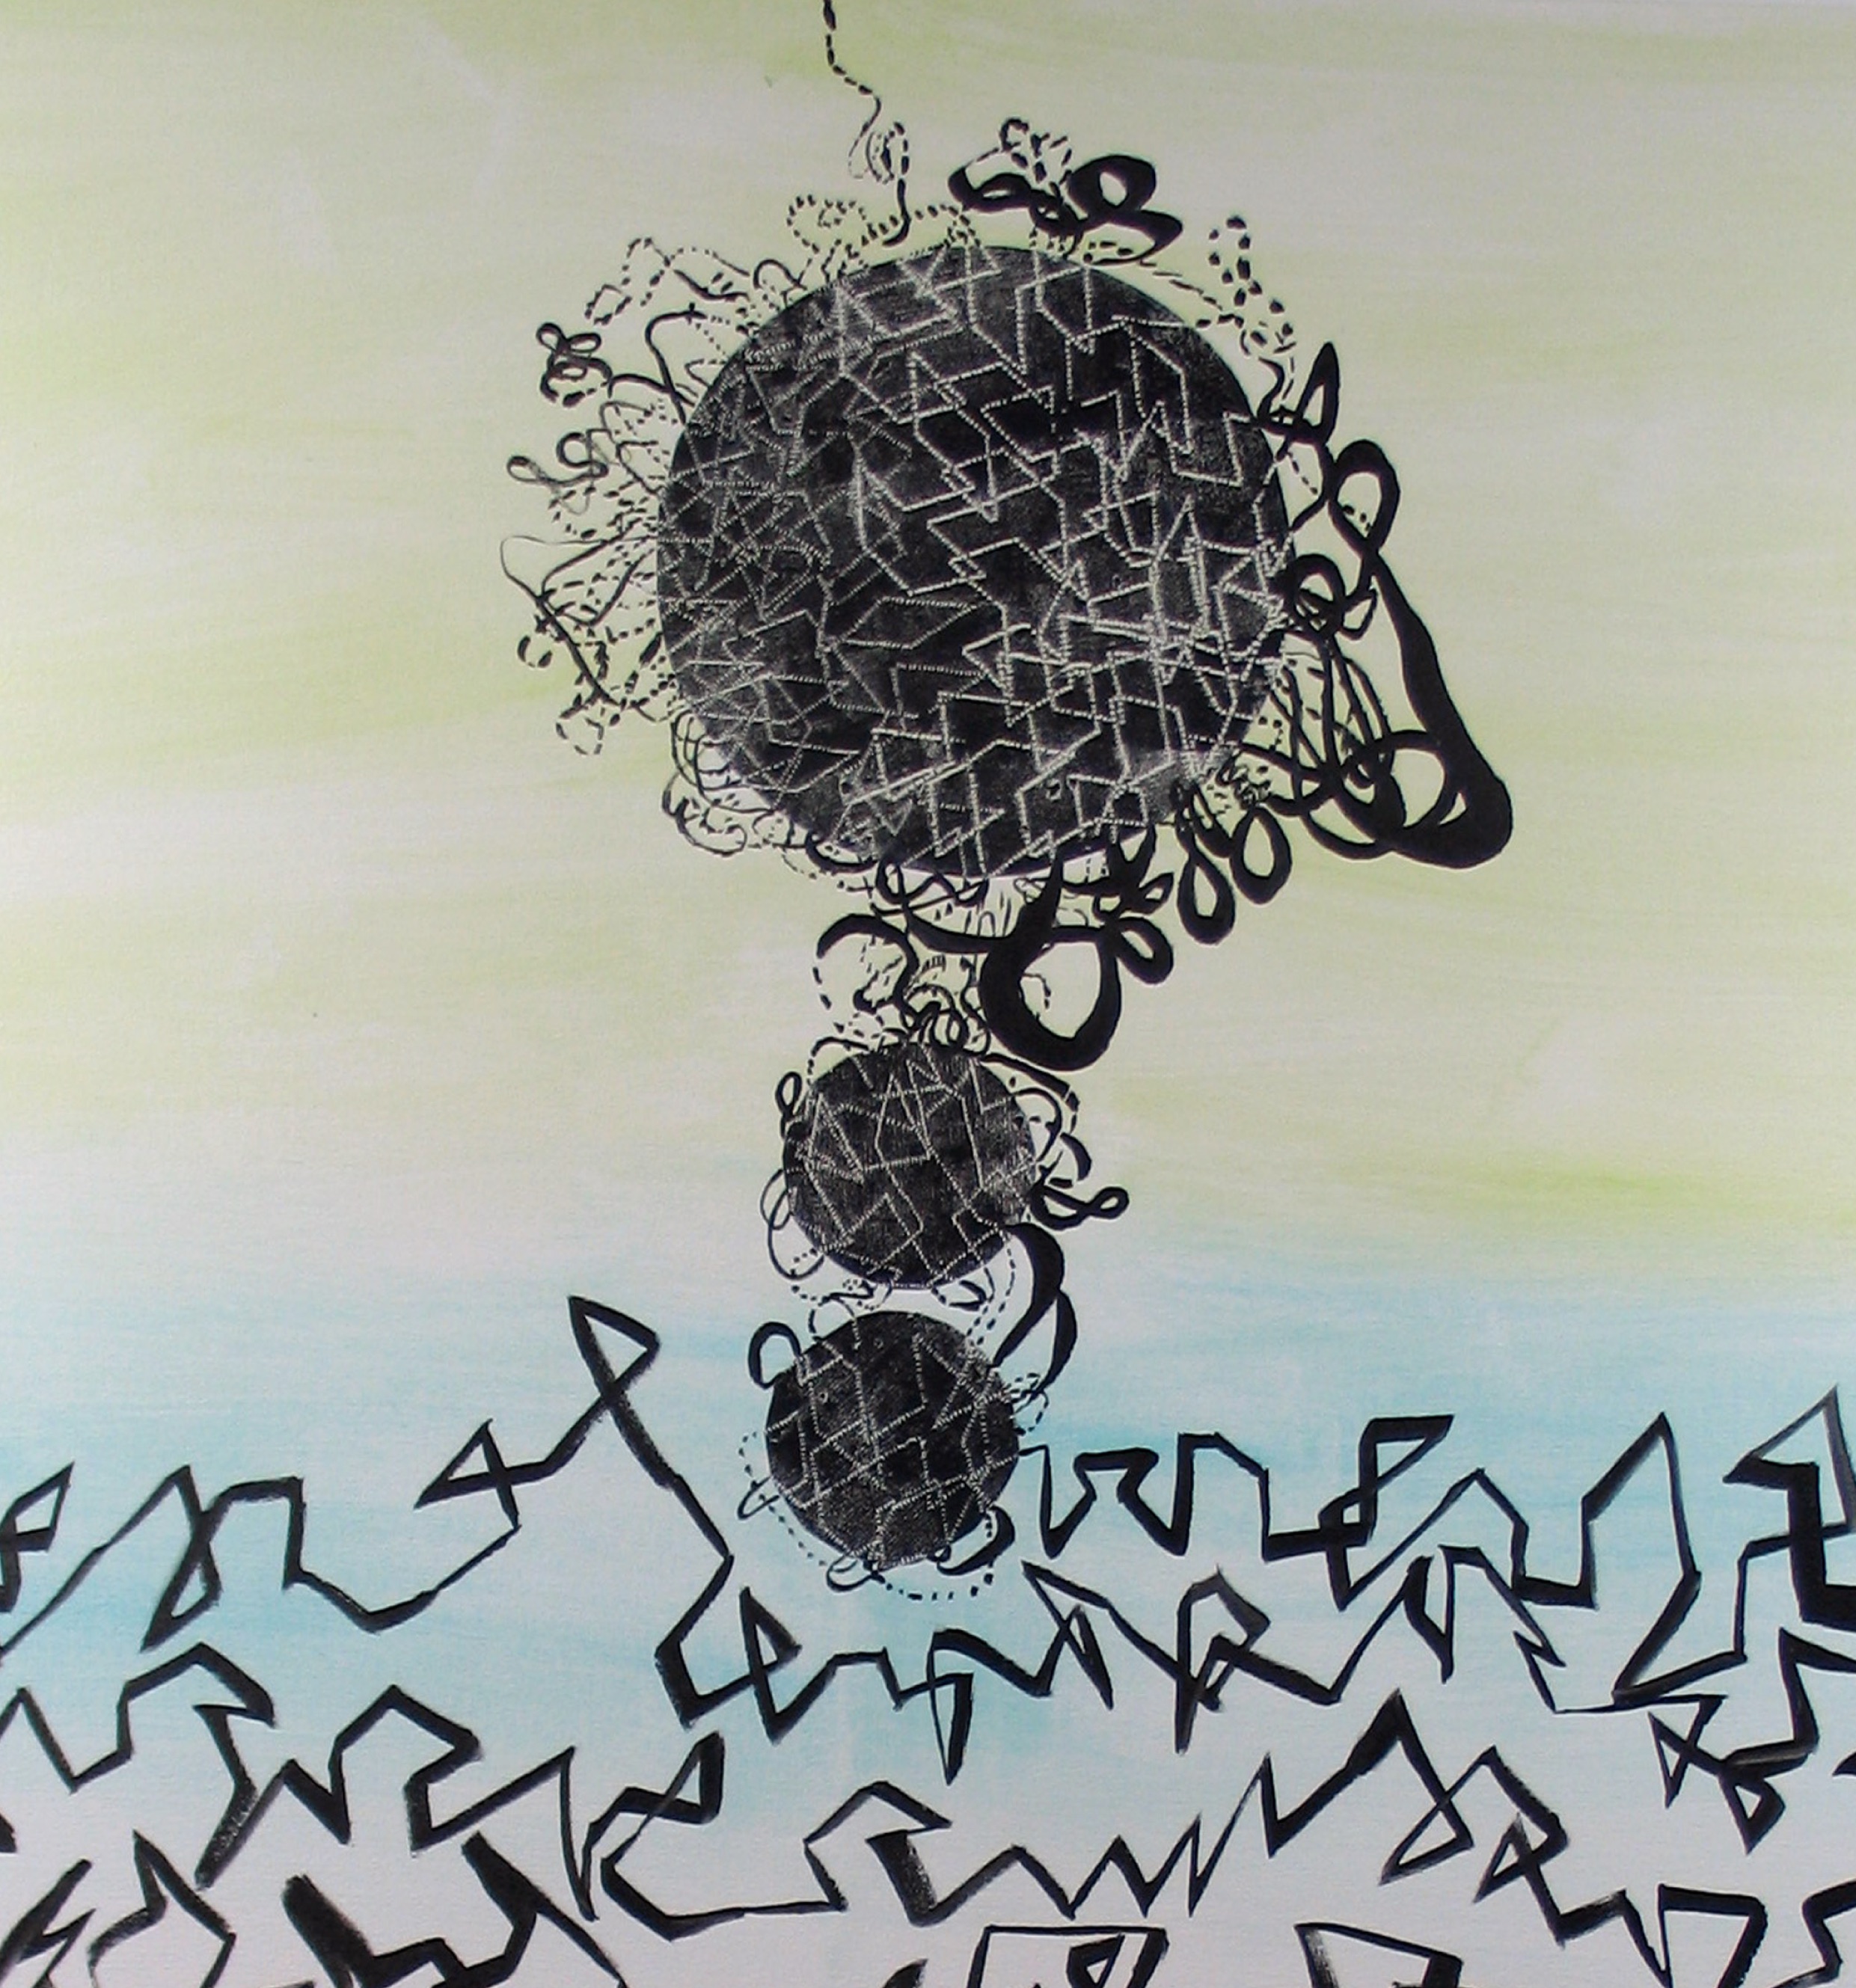
An artwork inspired by the problem of genome folding, by Broad Institute Artist-in-Residence Guhapriya Ranganathan. This originally appeared in her exhibition, Unfolding.
Credit: Guhapriya Ranganathan. -
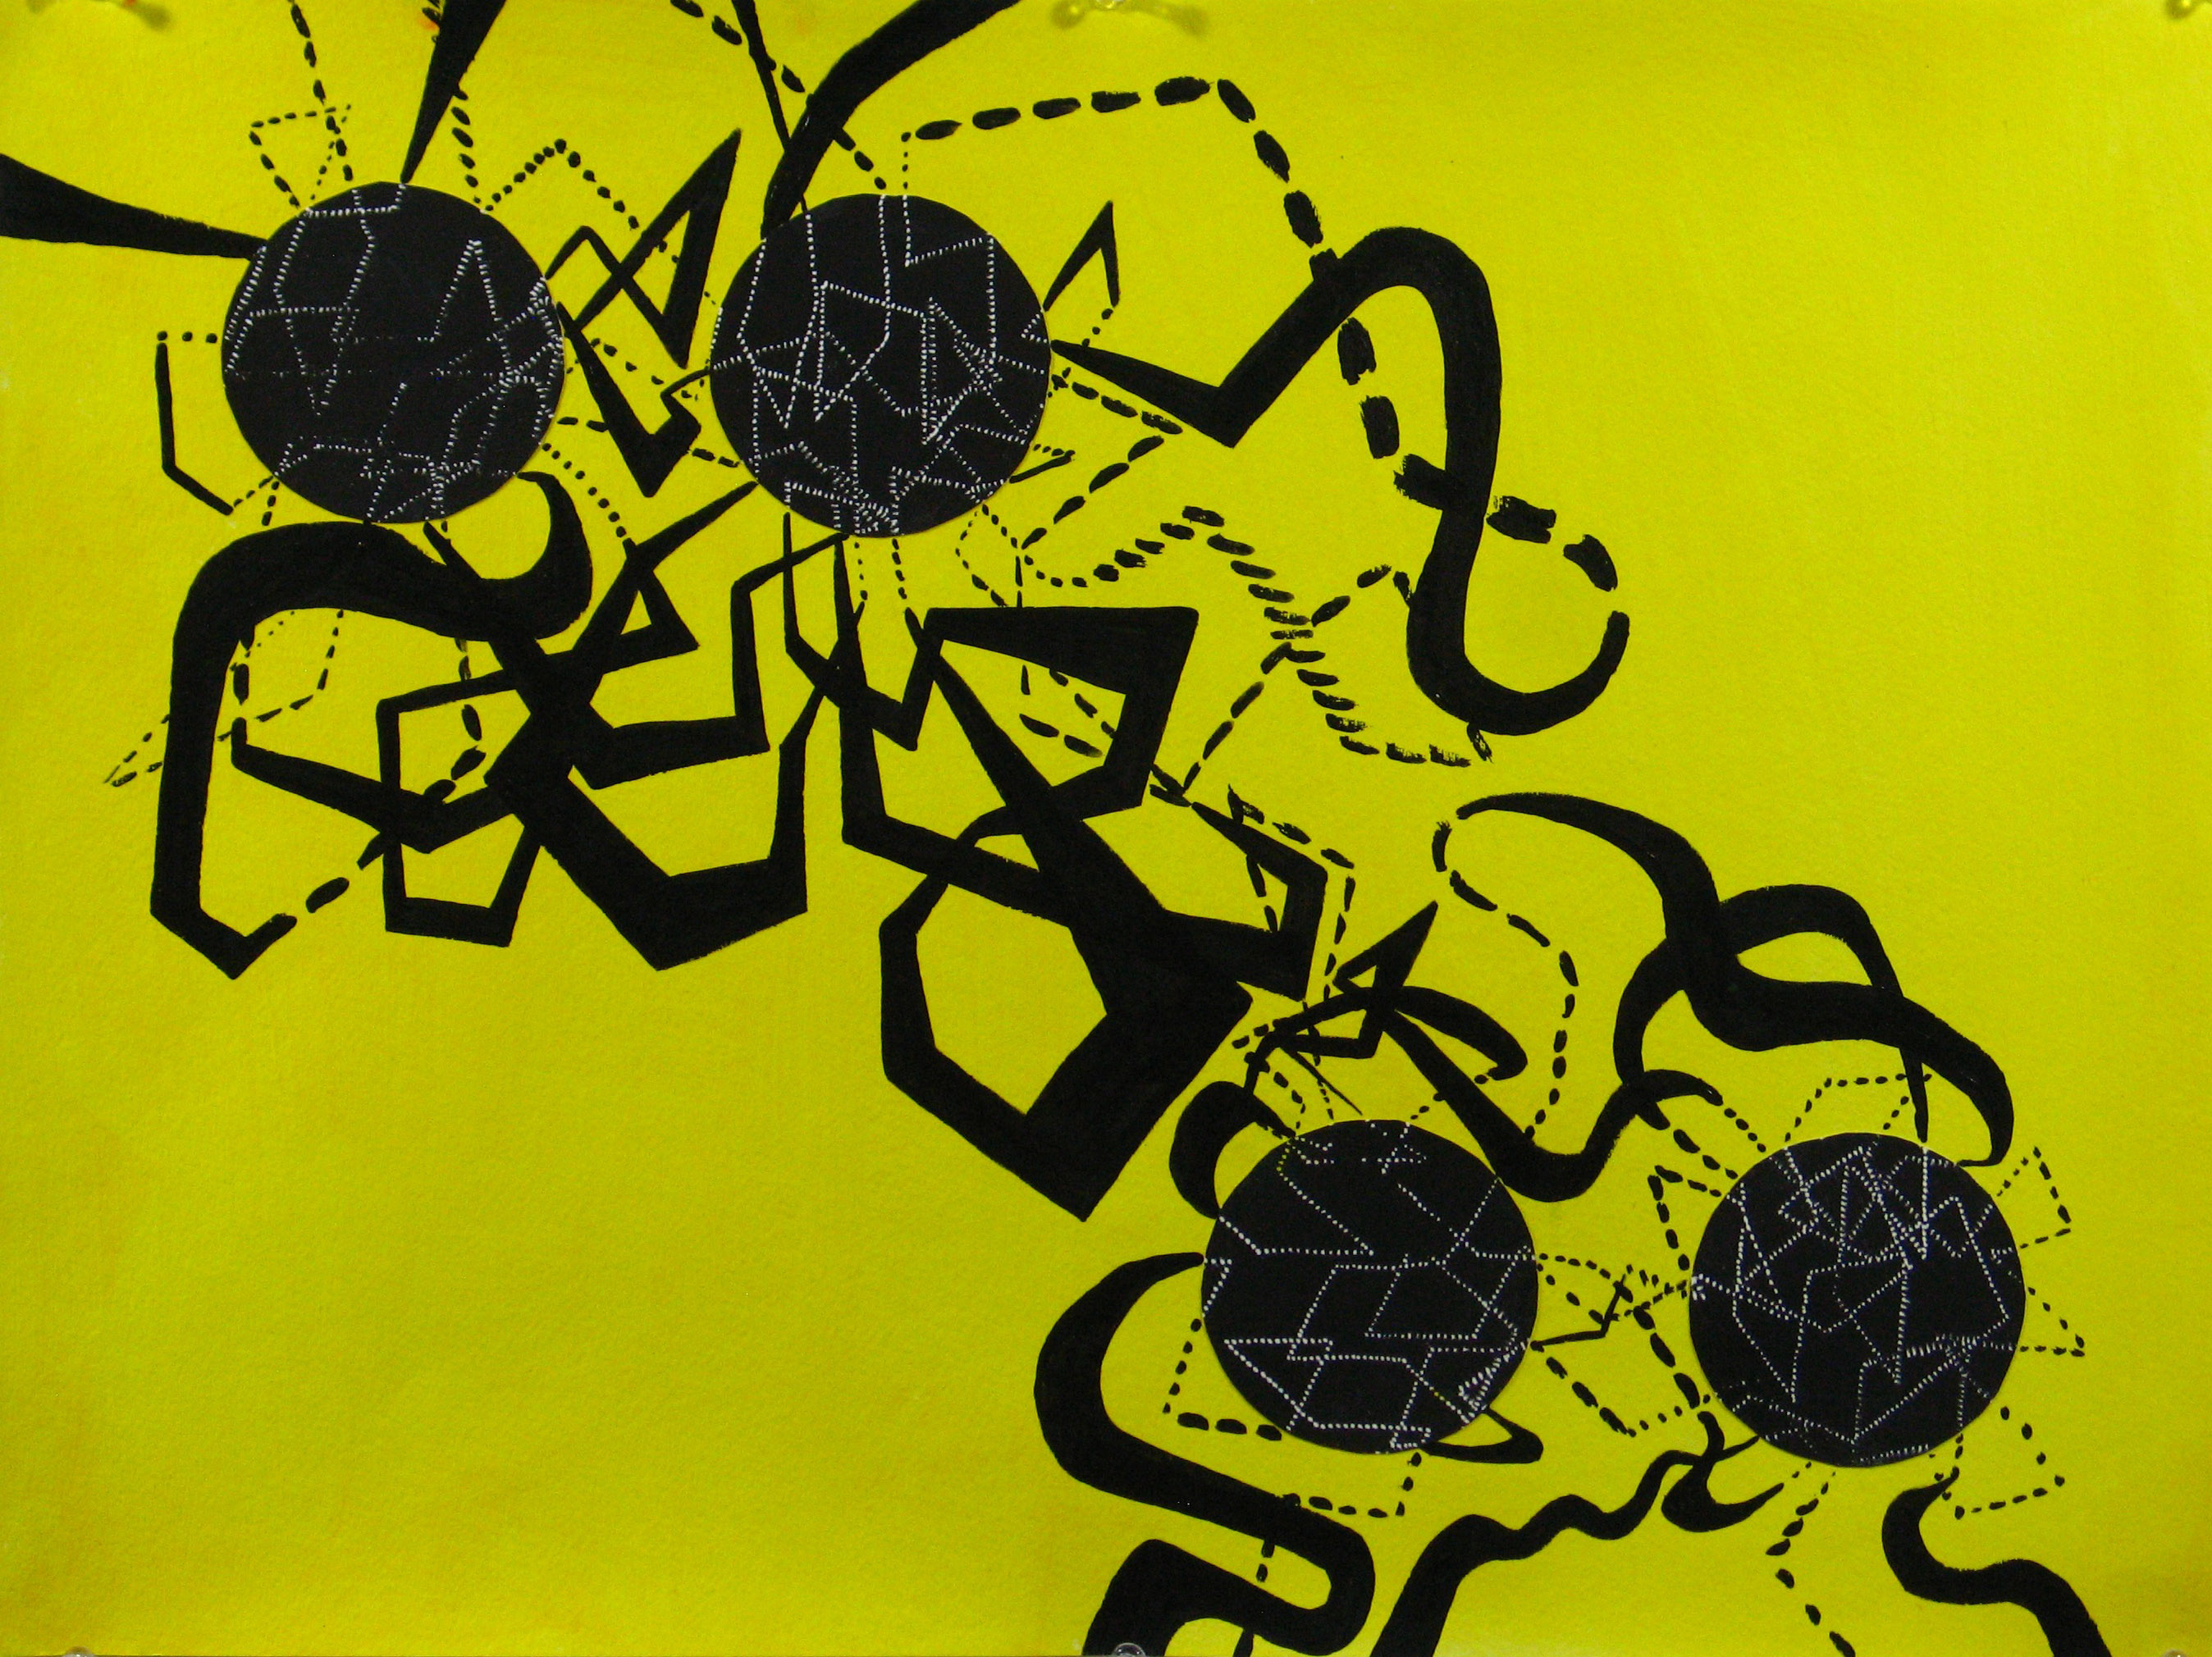
Artist's Interpretation, Guhapriya Ranganathan 2
An artwork inspired by the problem of genome folding, by Broad Institute Artist-in-Residence Guhapriya Ranganathan. This originally appeared in her exhibition, Unfolding.
Credit: Guhapriya Ranganathan. -

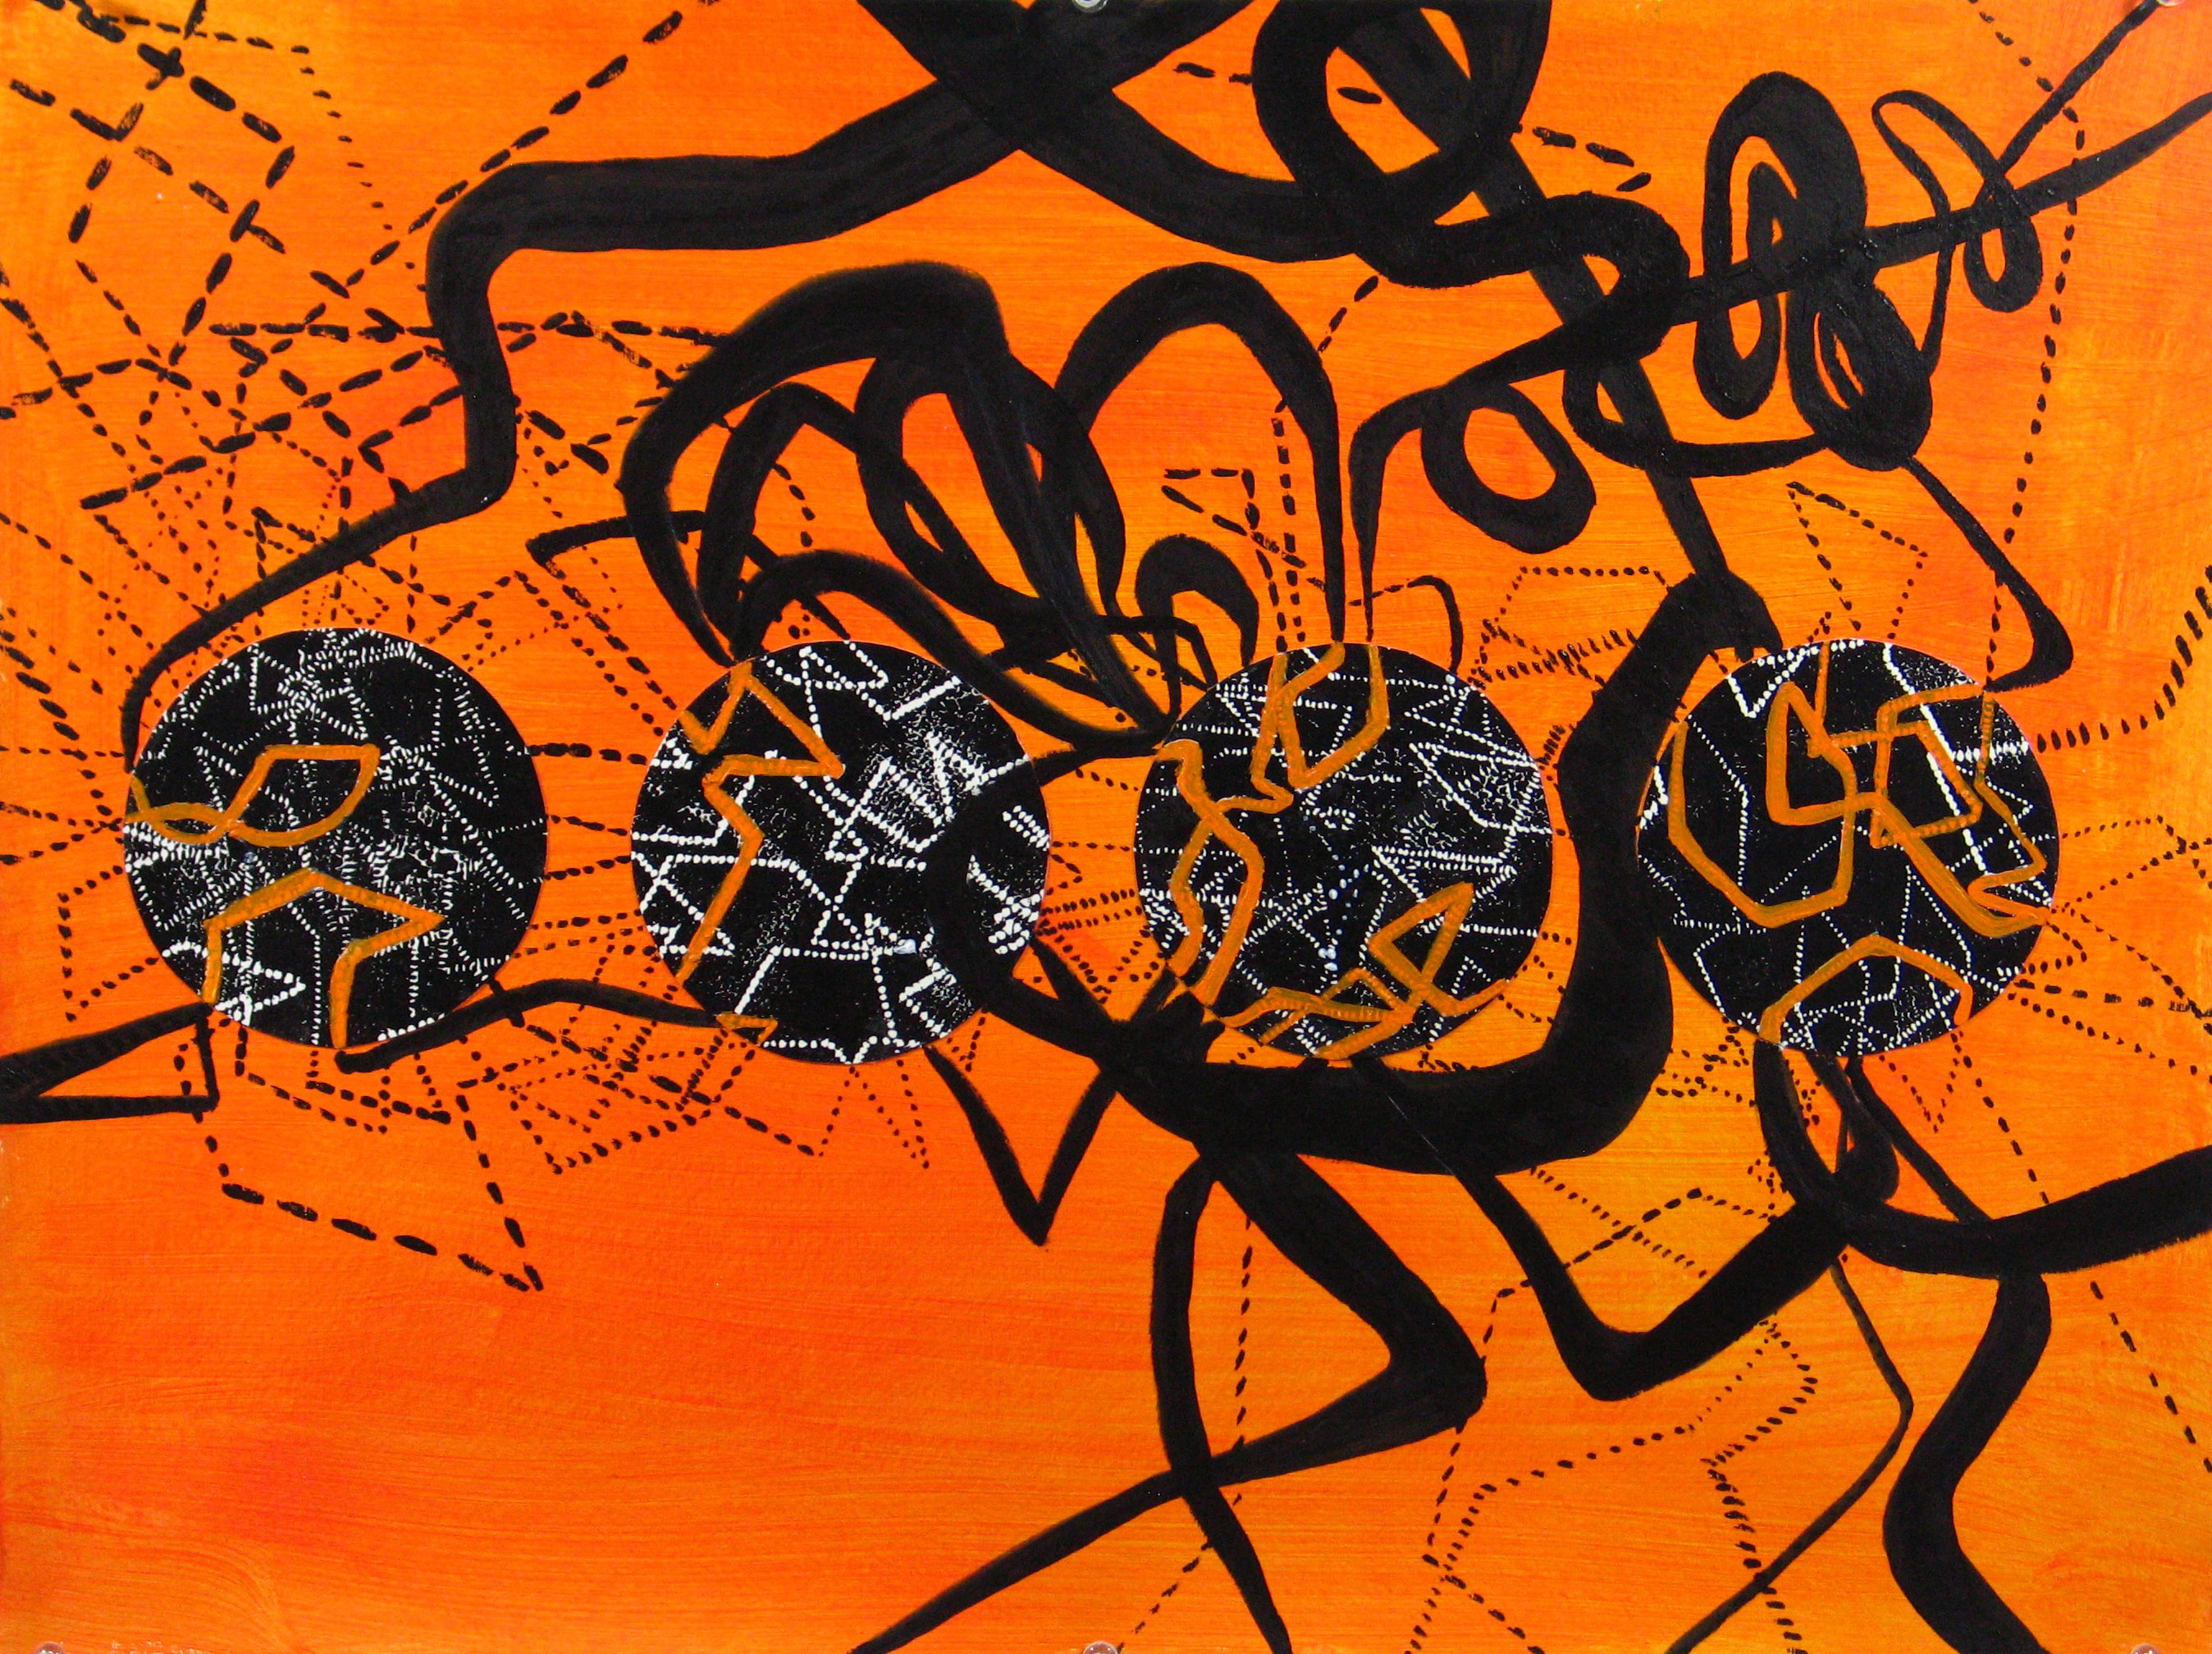
Artist's Interpretation, Guhapriya Ranganathan 3
An artwork inspired by the problem of genome folding, by Broad Institute Artist-in-Residence Guhapriya Ranganathan. This originally appeared in her exhibition, Unfolding.
Credit: Guhapriya Ranganathan. -
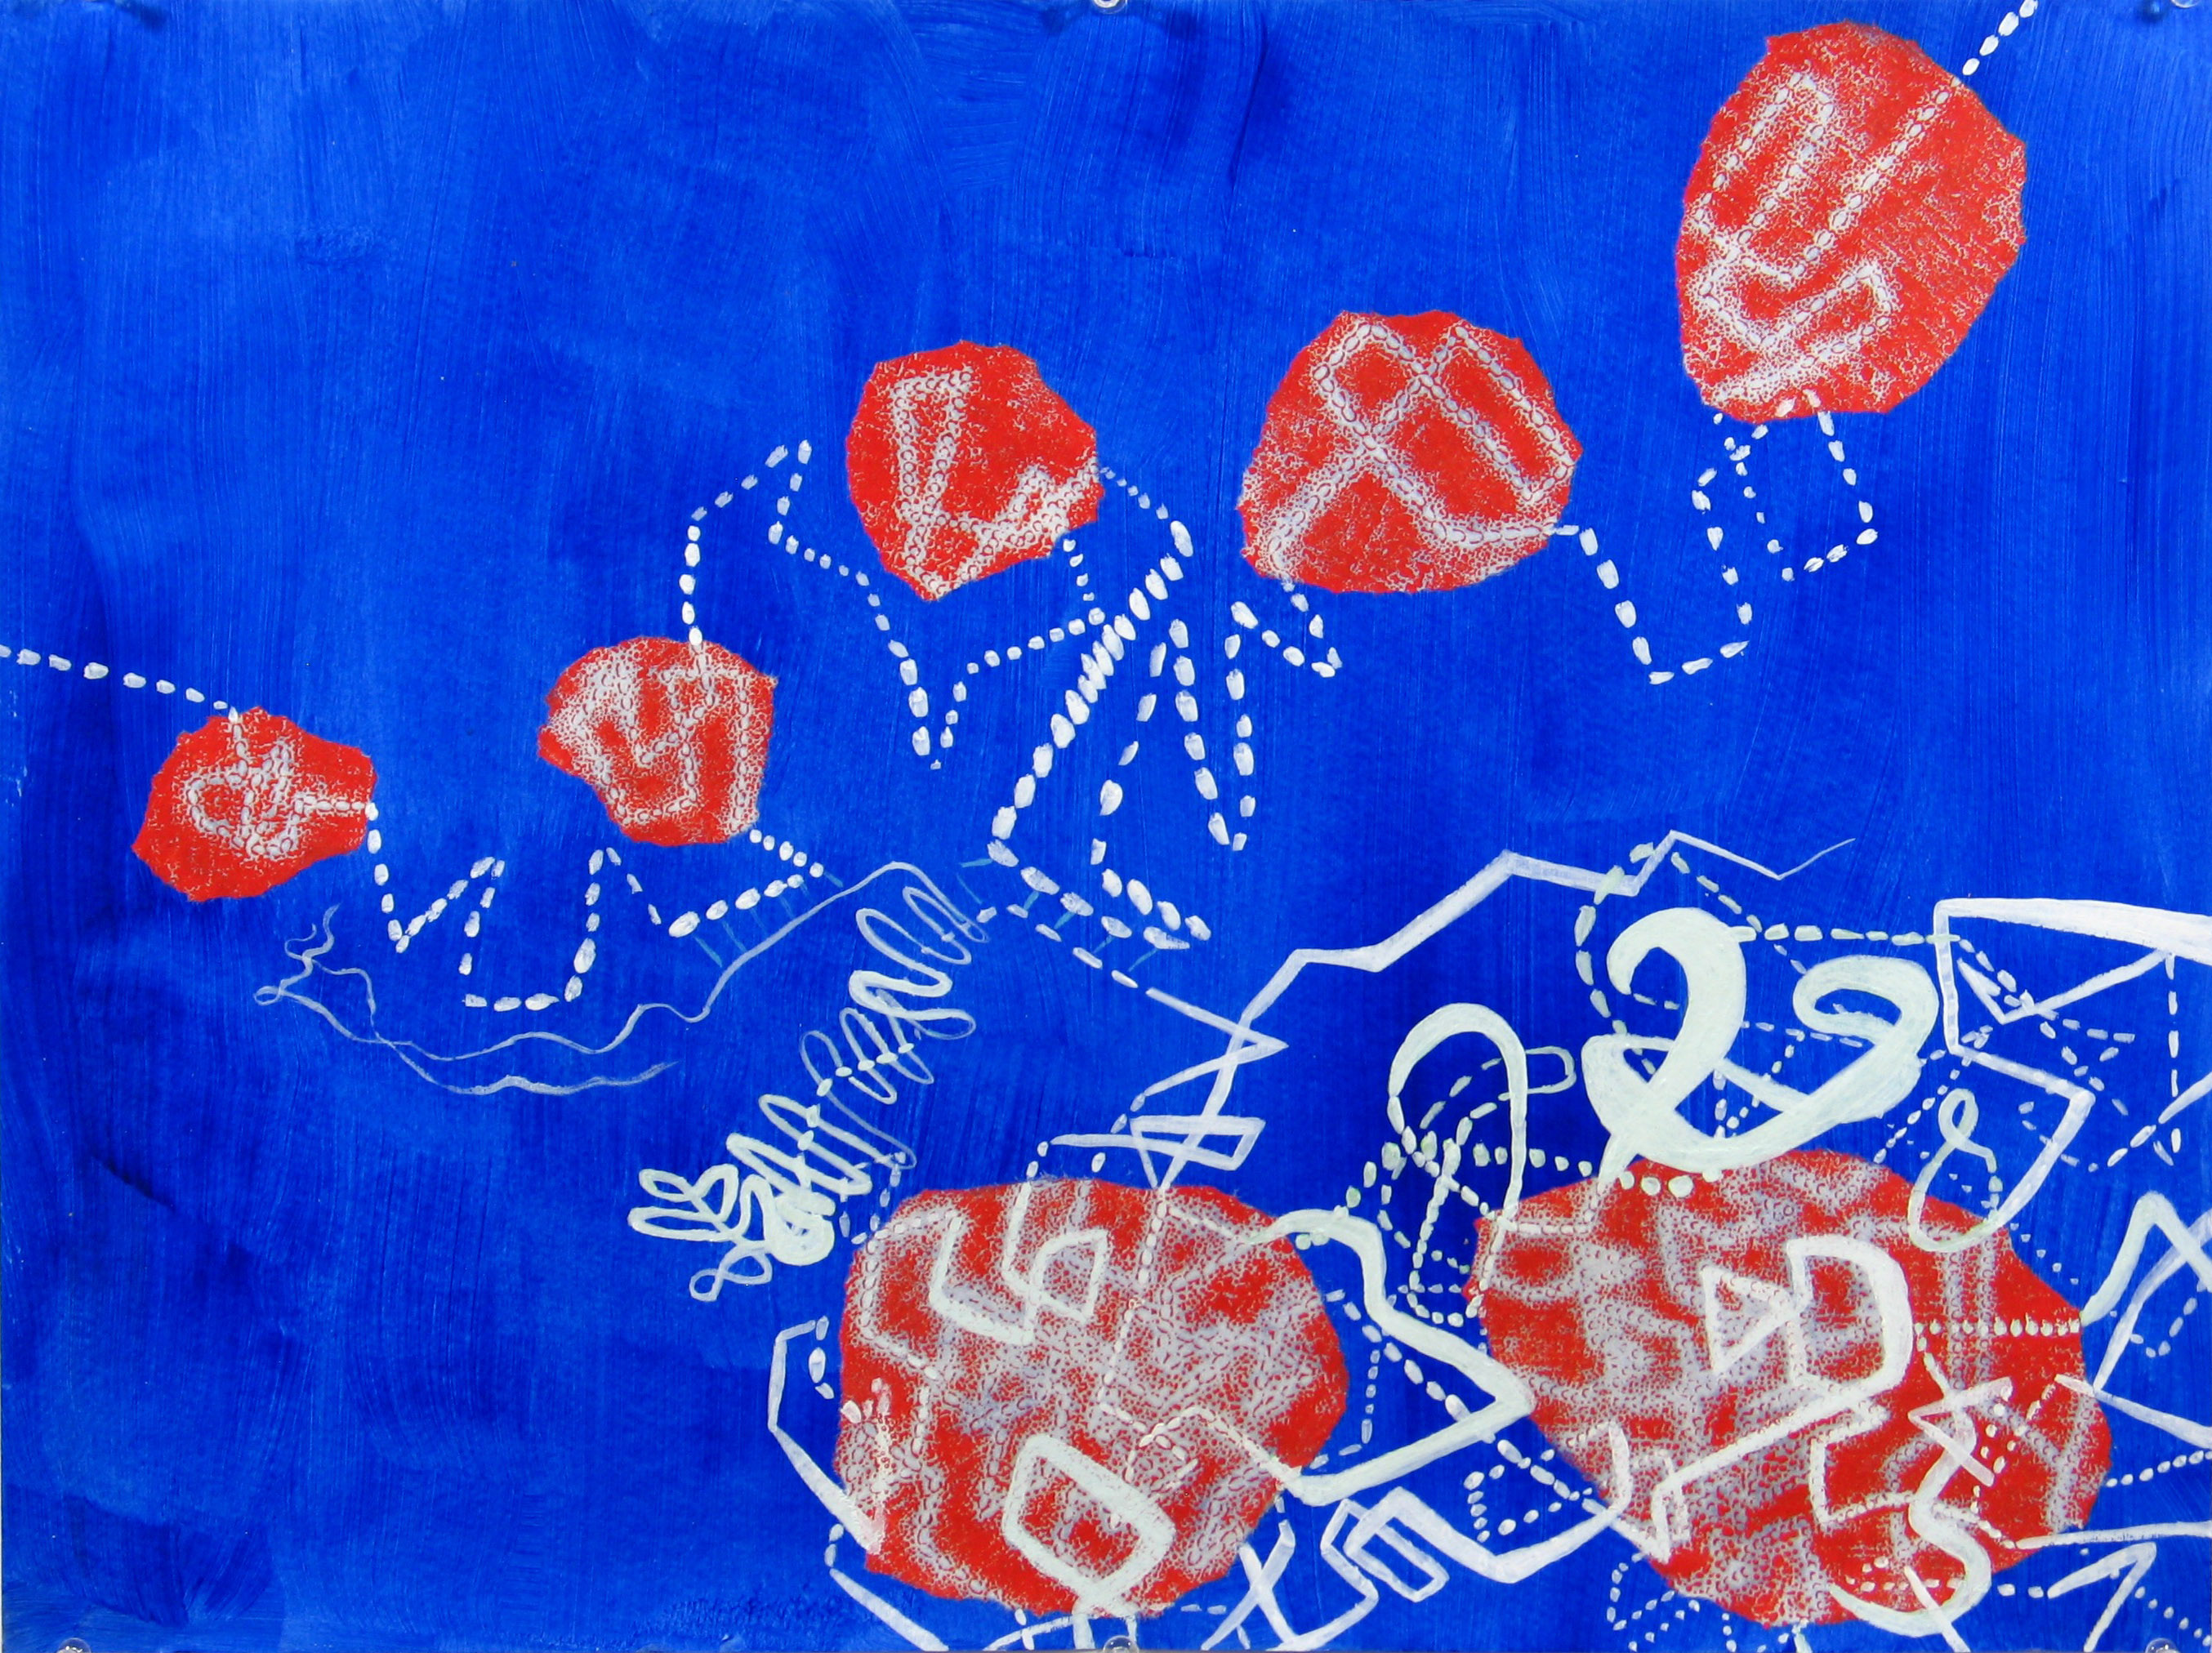
Artist's Interpretation, Guhapriya Ranganathan 4
An artwork inspired by the problem of genome folding, by Broad Institute Artist-in-Residence Guhapriya Ranganathan. This originally appeared in her exhibition, Unfolding.
Credit: Guhapriya Ranganathan. -
Artist's Interpretation, Guhapriya Ranganathan 5
An artwork inspired by the problem of genome folding, by Broad Institute Artist-in-Residence Guhapriya Ranganathan. This originally appeared in her exhibition, Unfolding.
Credit: Guhapriya Ranganathan. -
Artist's Interpretation, Guhapriya Ranganathan 6
An artwork inspired by the problem of genome folding, by Broad Institute Artist-in-Residence Guhapriya Ranganathan. This originally appeared in her exhibition, Unfolding.
Credit: Guhapriya Ranganathan. -
Tension Globule 1
Physics simulation of a small interval of DNA collapsed into a tension globule, a polymer state proposed by Physics Nobel Laureate Pierre-Gilles de Gennes.
Credit: Adrian Sanborn, Erez Lieberman Aiden. -
Tension Globule 2
Physics simulation of a small interval of DNA collapsed into a tension globule, a polymer state proposed by Physics Nobel Laureate Pierre-Gilles de Gennes.
Credit: Adrian Sanborn, Erez Lieberman Aiden. -
Tension Globule 3
Physics simulation of a small interval of DNA collapsed into a tension globule, a polymer state proposed by Physics Nobel Laureate Pierre-Gilles de Gennes.
Credit: Adrian Sanborn, Erez Lieberman Aiden. -
Tension Globule 4
Physics simulation of a small interval of DNA collapsed into a tension globule, a polymer state proposed by Physics Nobel Laureate Pierre-Gilles de Gennes.
Credit: Adrian Sanborn, Erez Lieberman Aiden. -
Tension Globule 5
Physics simulation of a small interval of DNA collapsed into a tension globule, a polymer state proposed by Physics Nobel Laureate Pierre-Gilles de Gennes.
Credit: Adrian Sanborn, Erez Lieberman Aiden. -
Tension Globule 6
Physics simulation of a small interval of DNA collapsed into a tension globule, a polymer state proposed by Physics Nobel Laureate Pierre-Gilles de Gennes.
Credit: Adrian Sanborn, Erez Lieberman Aiden. -
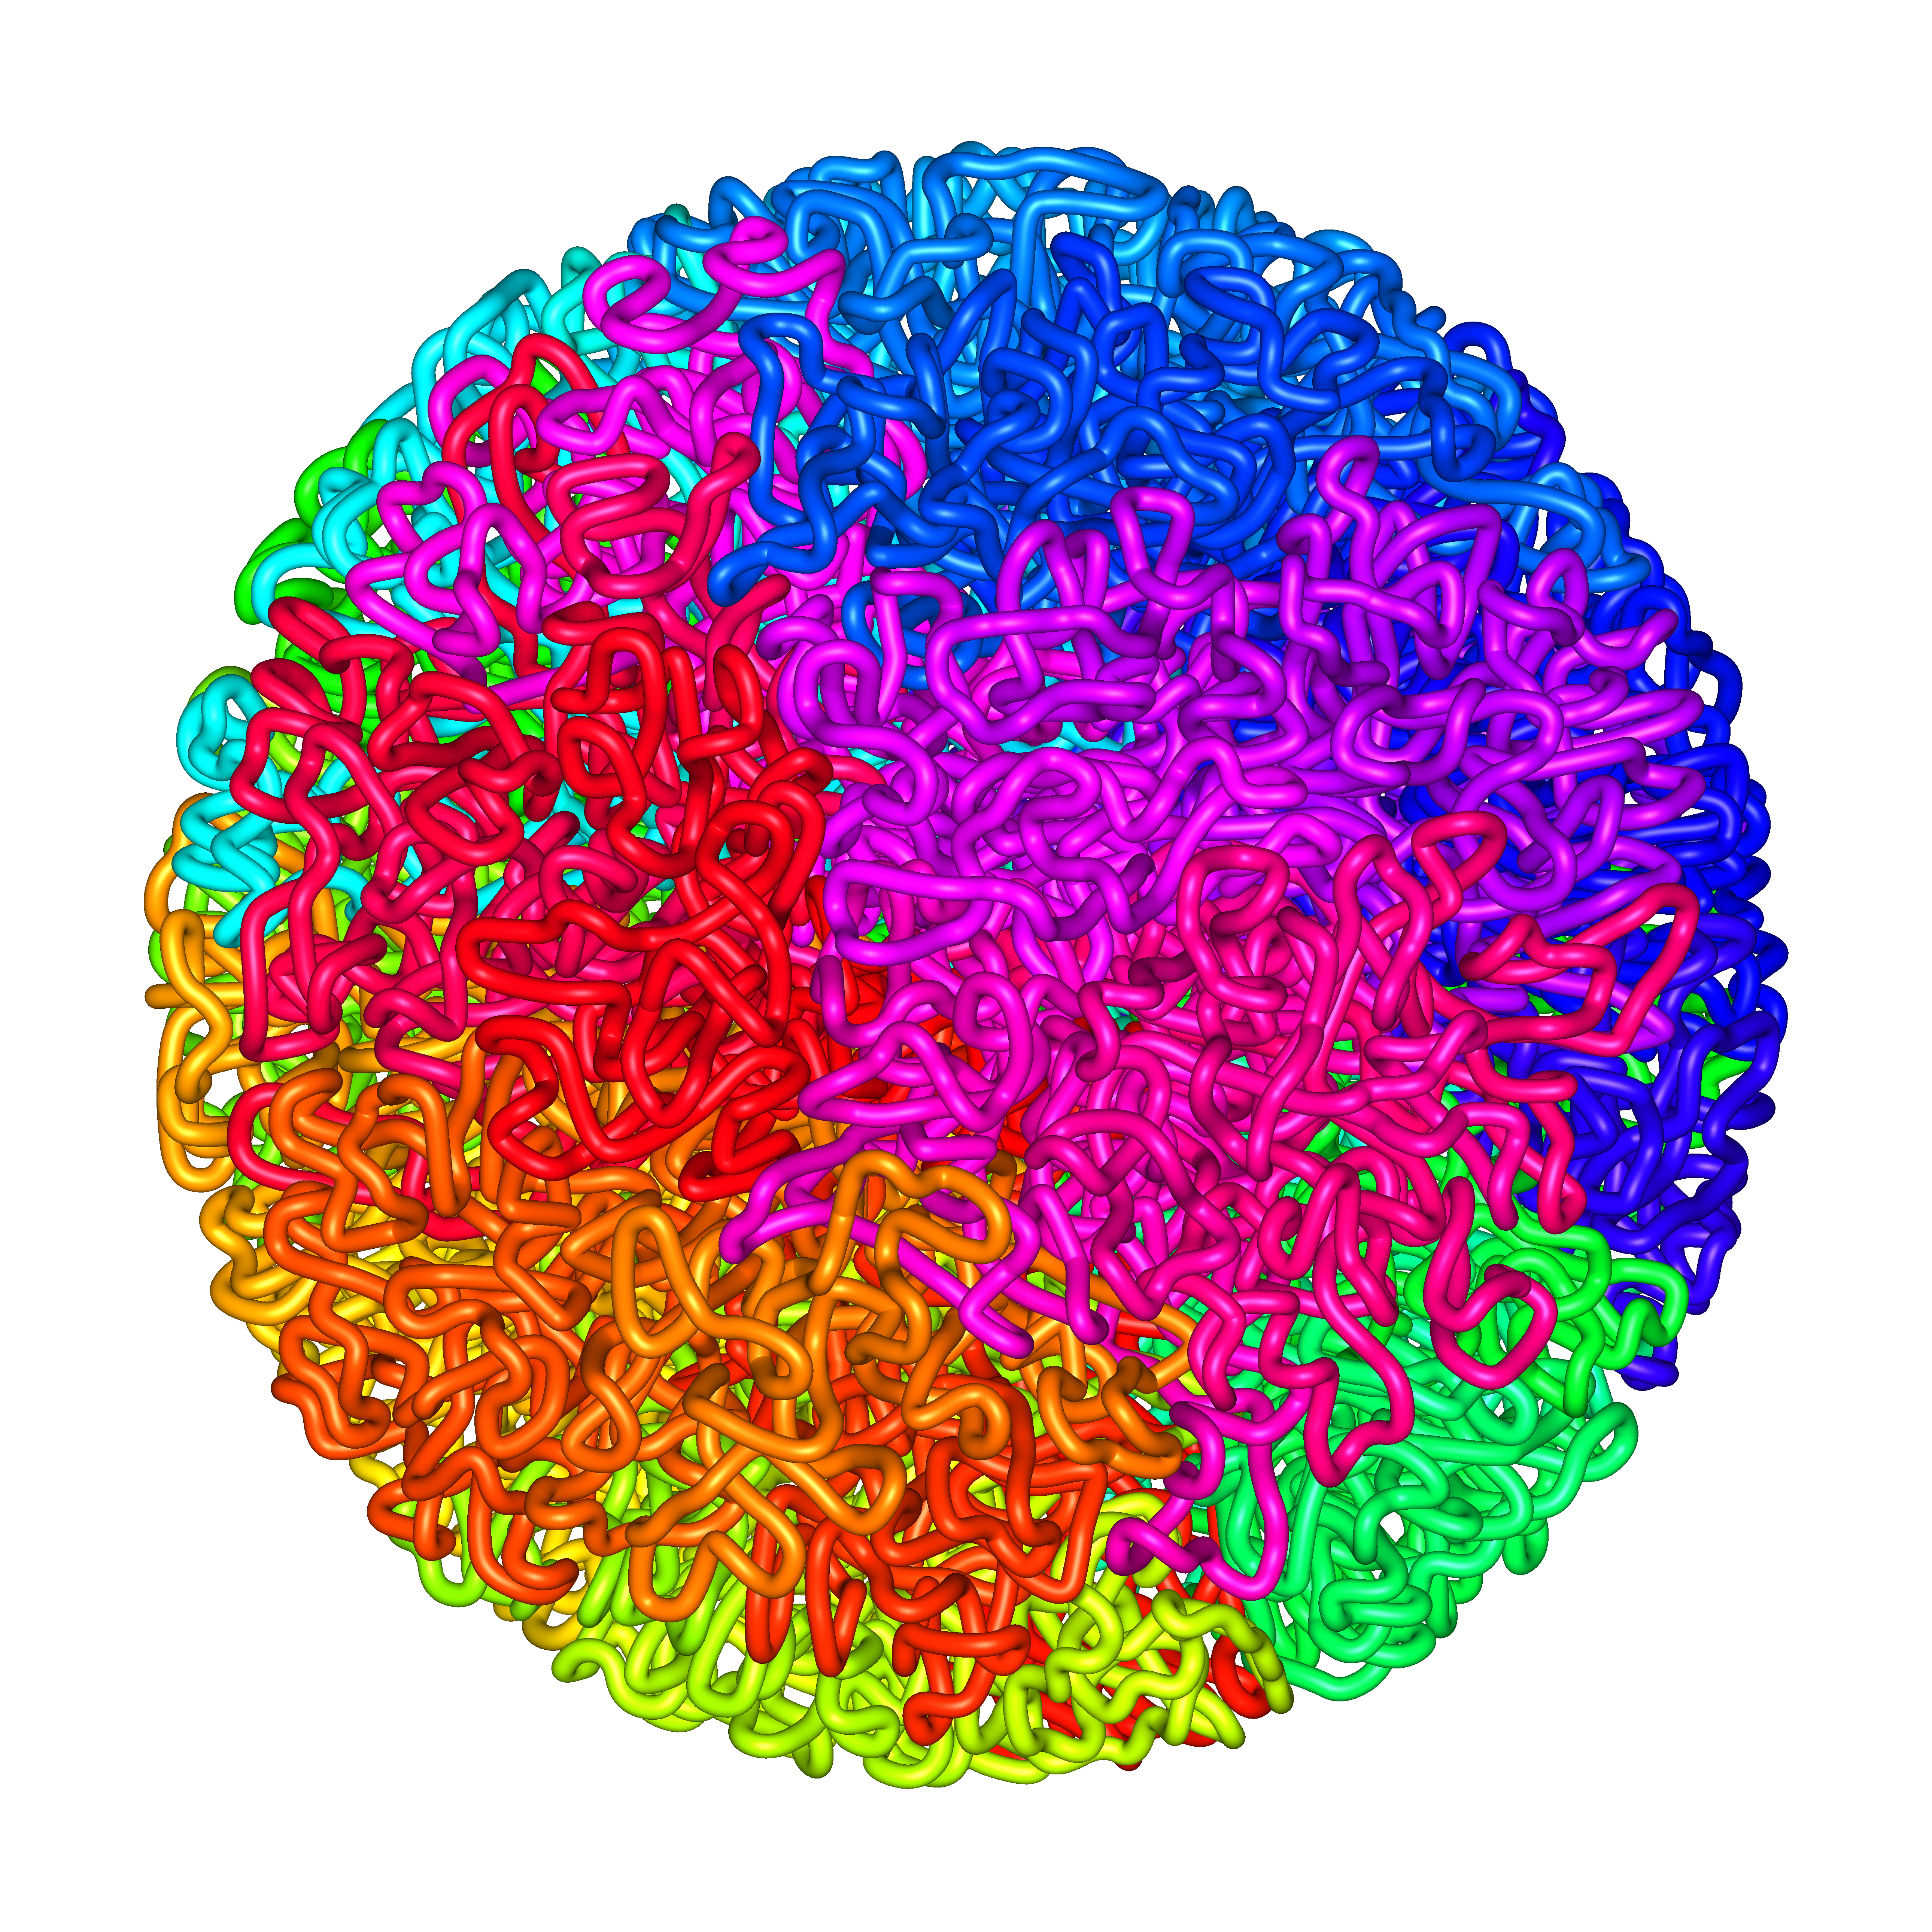
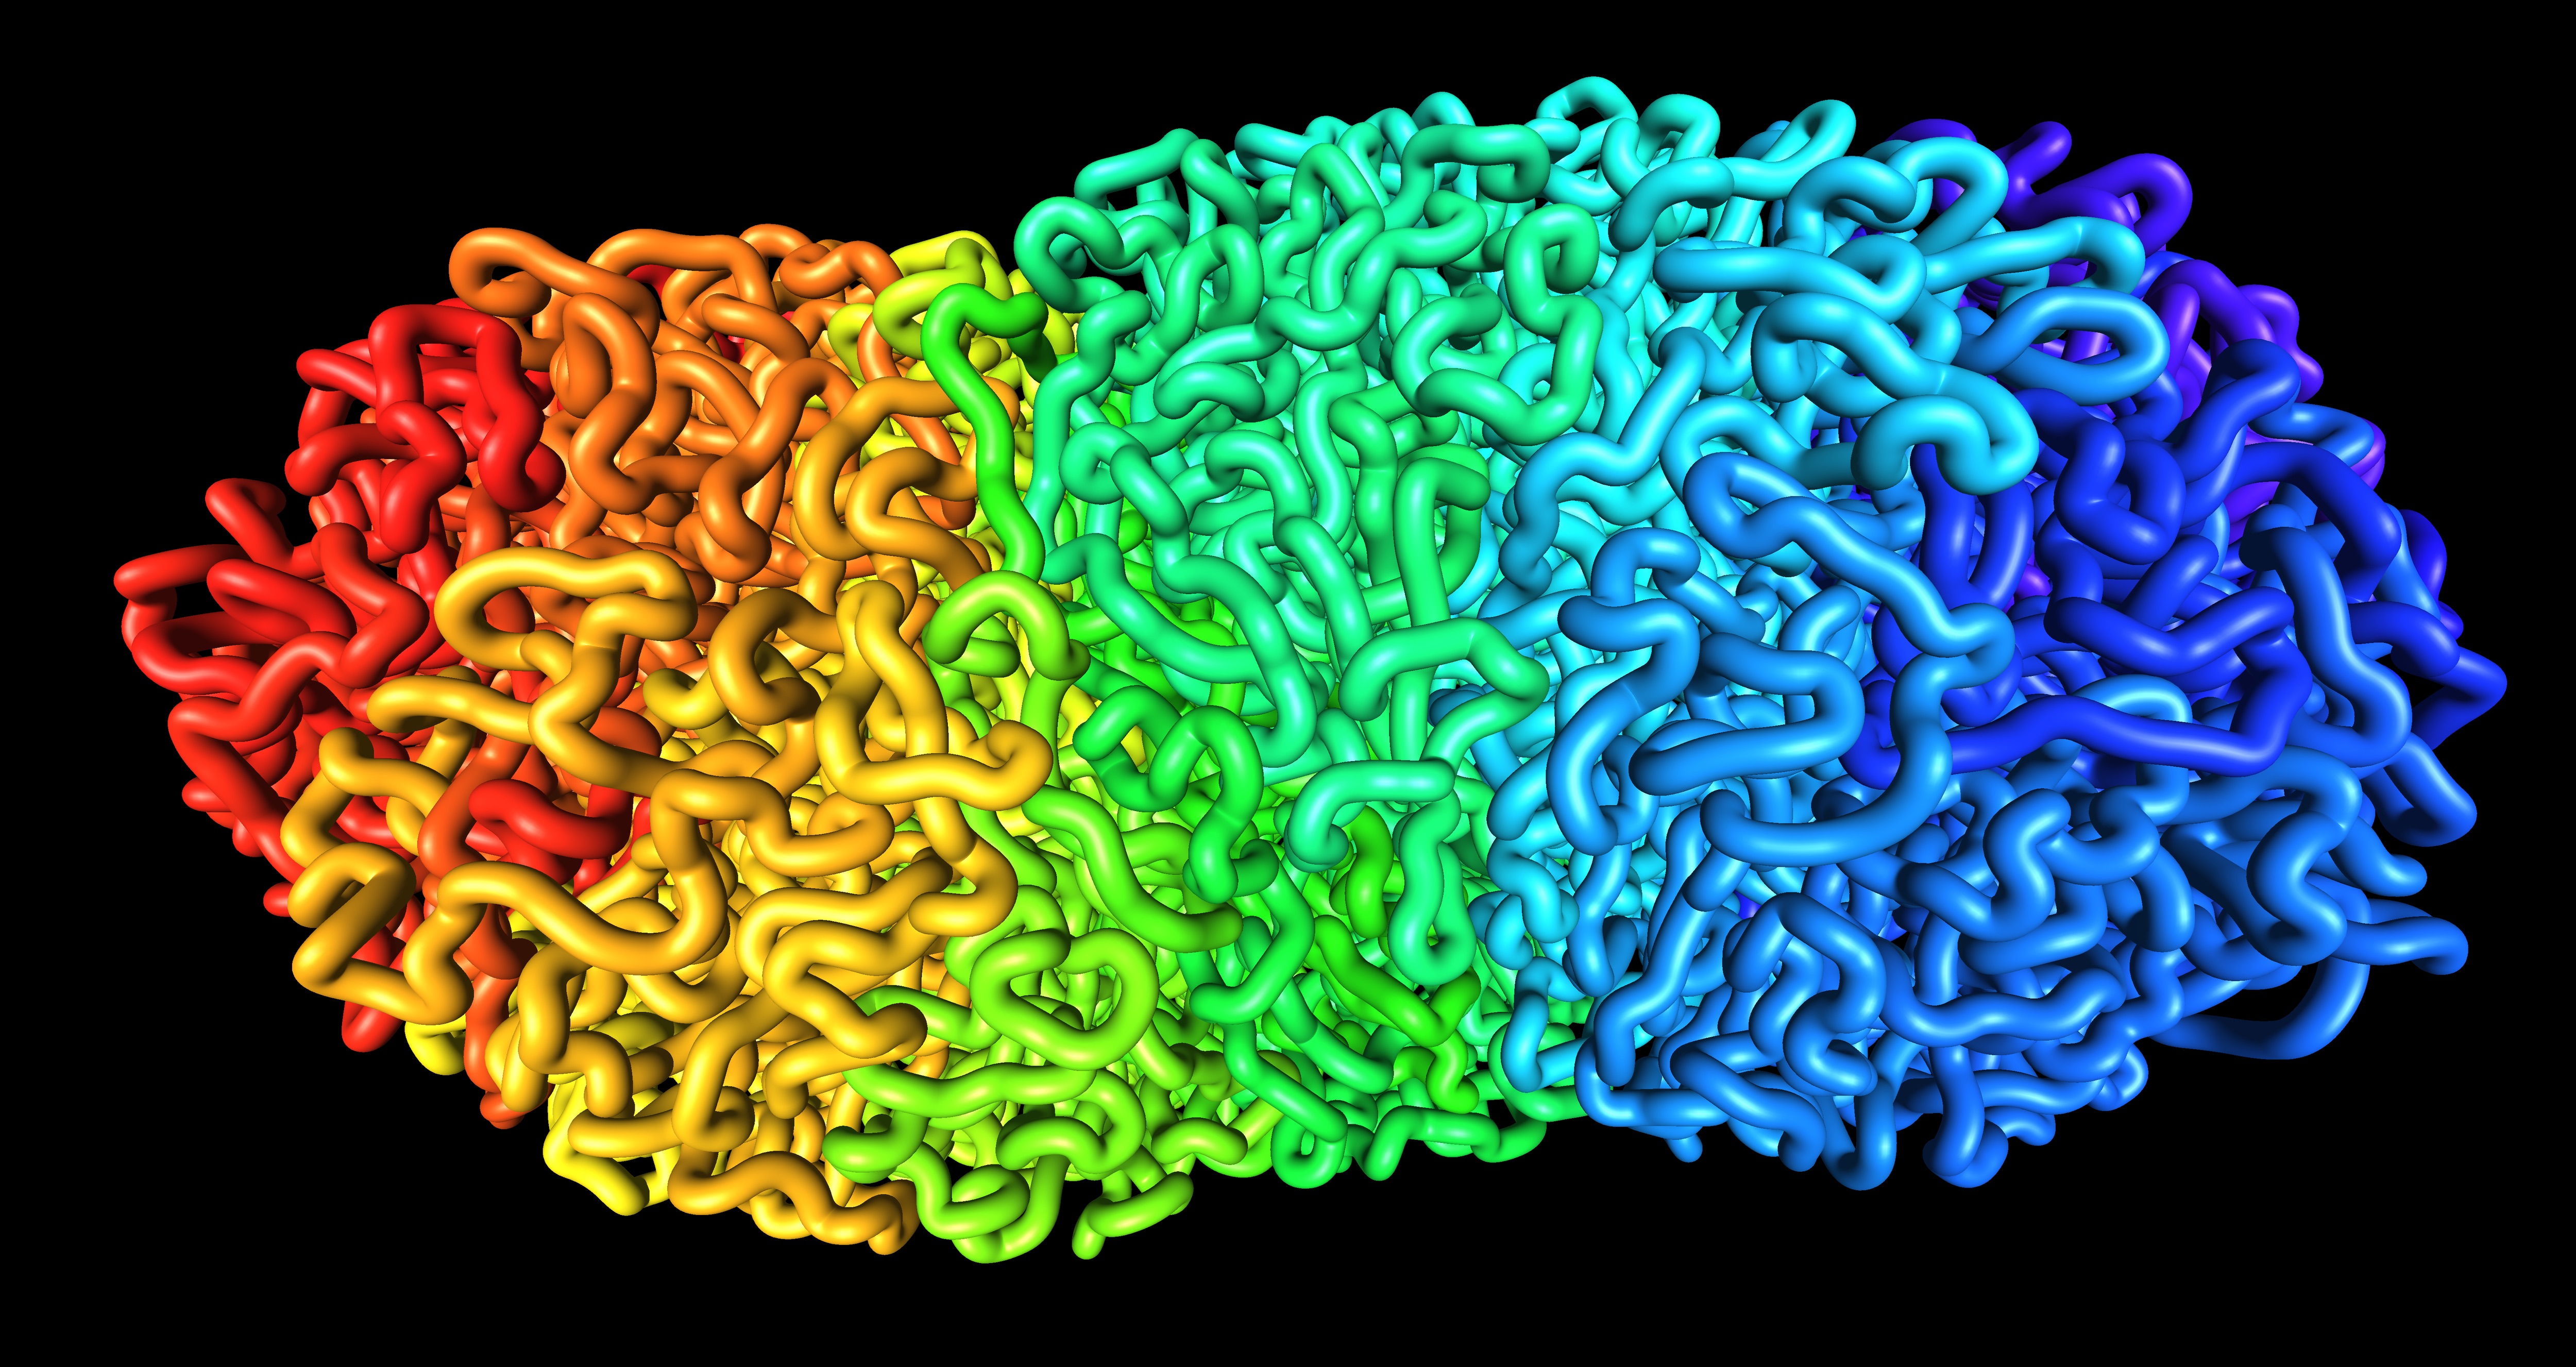
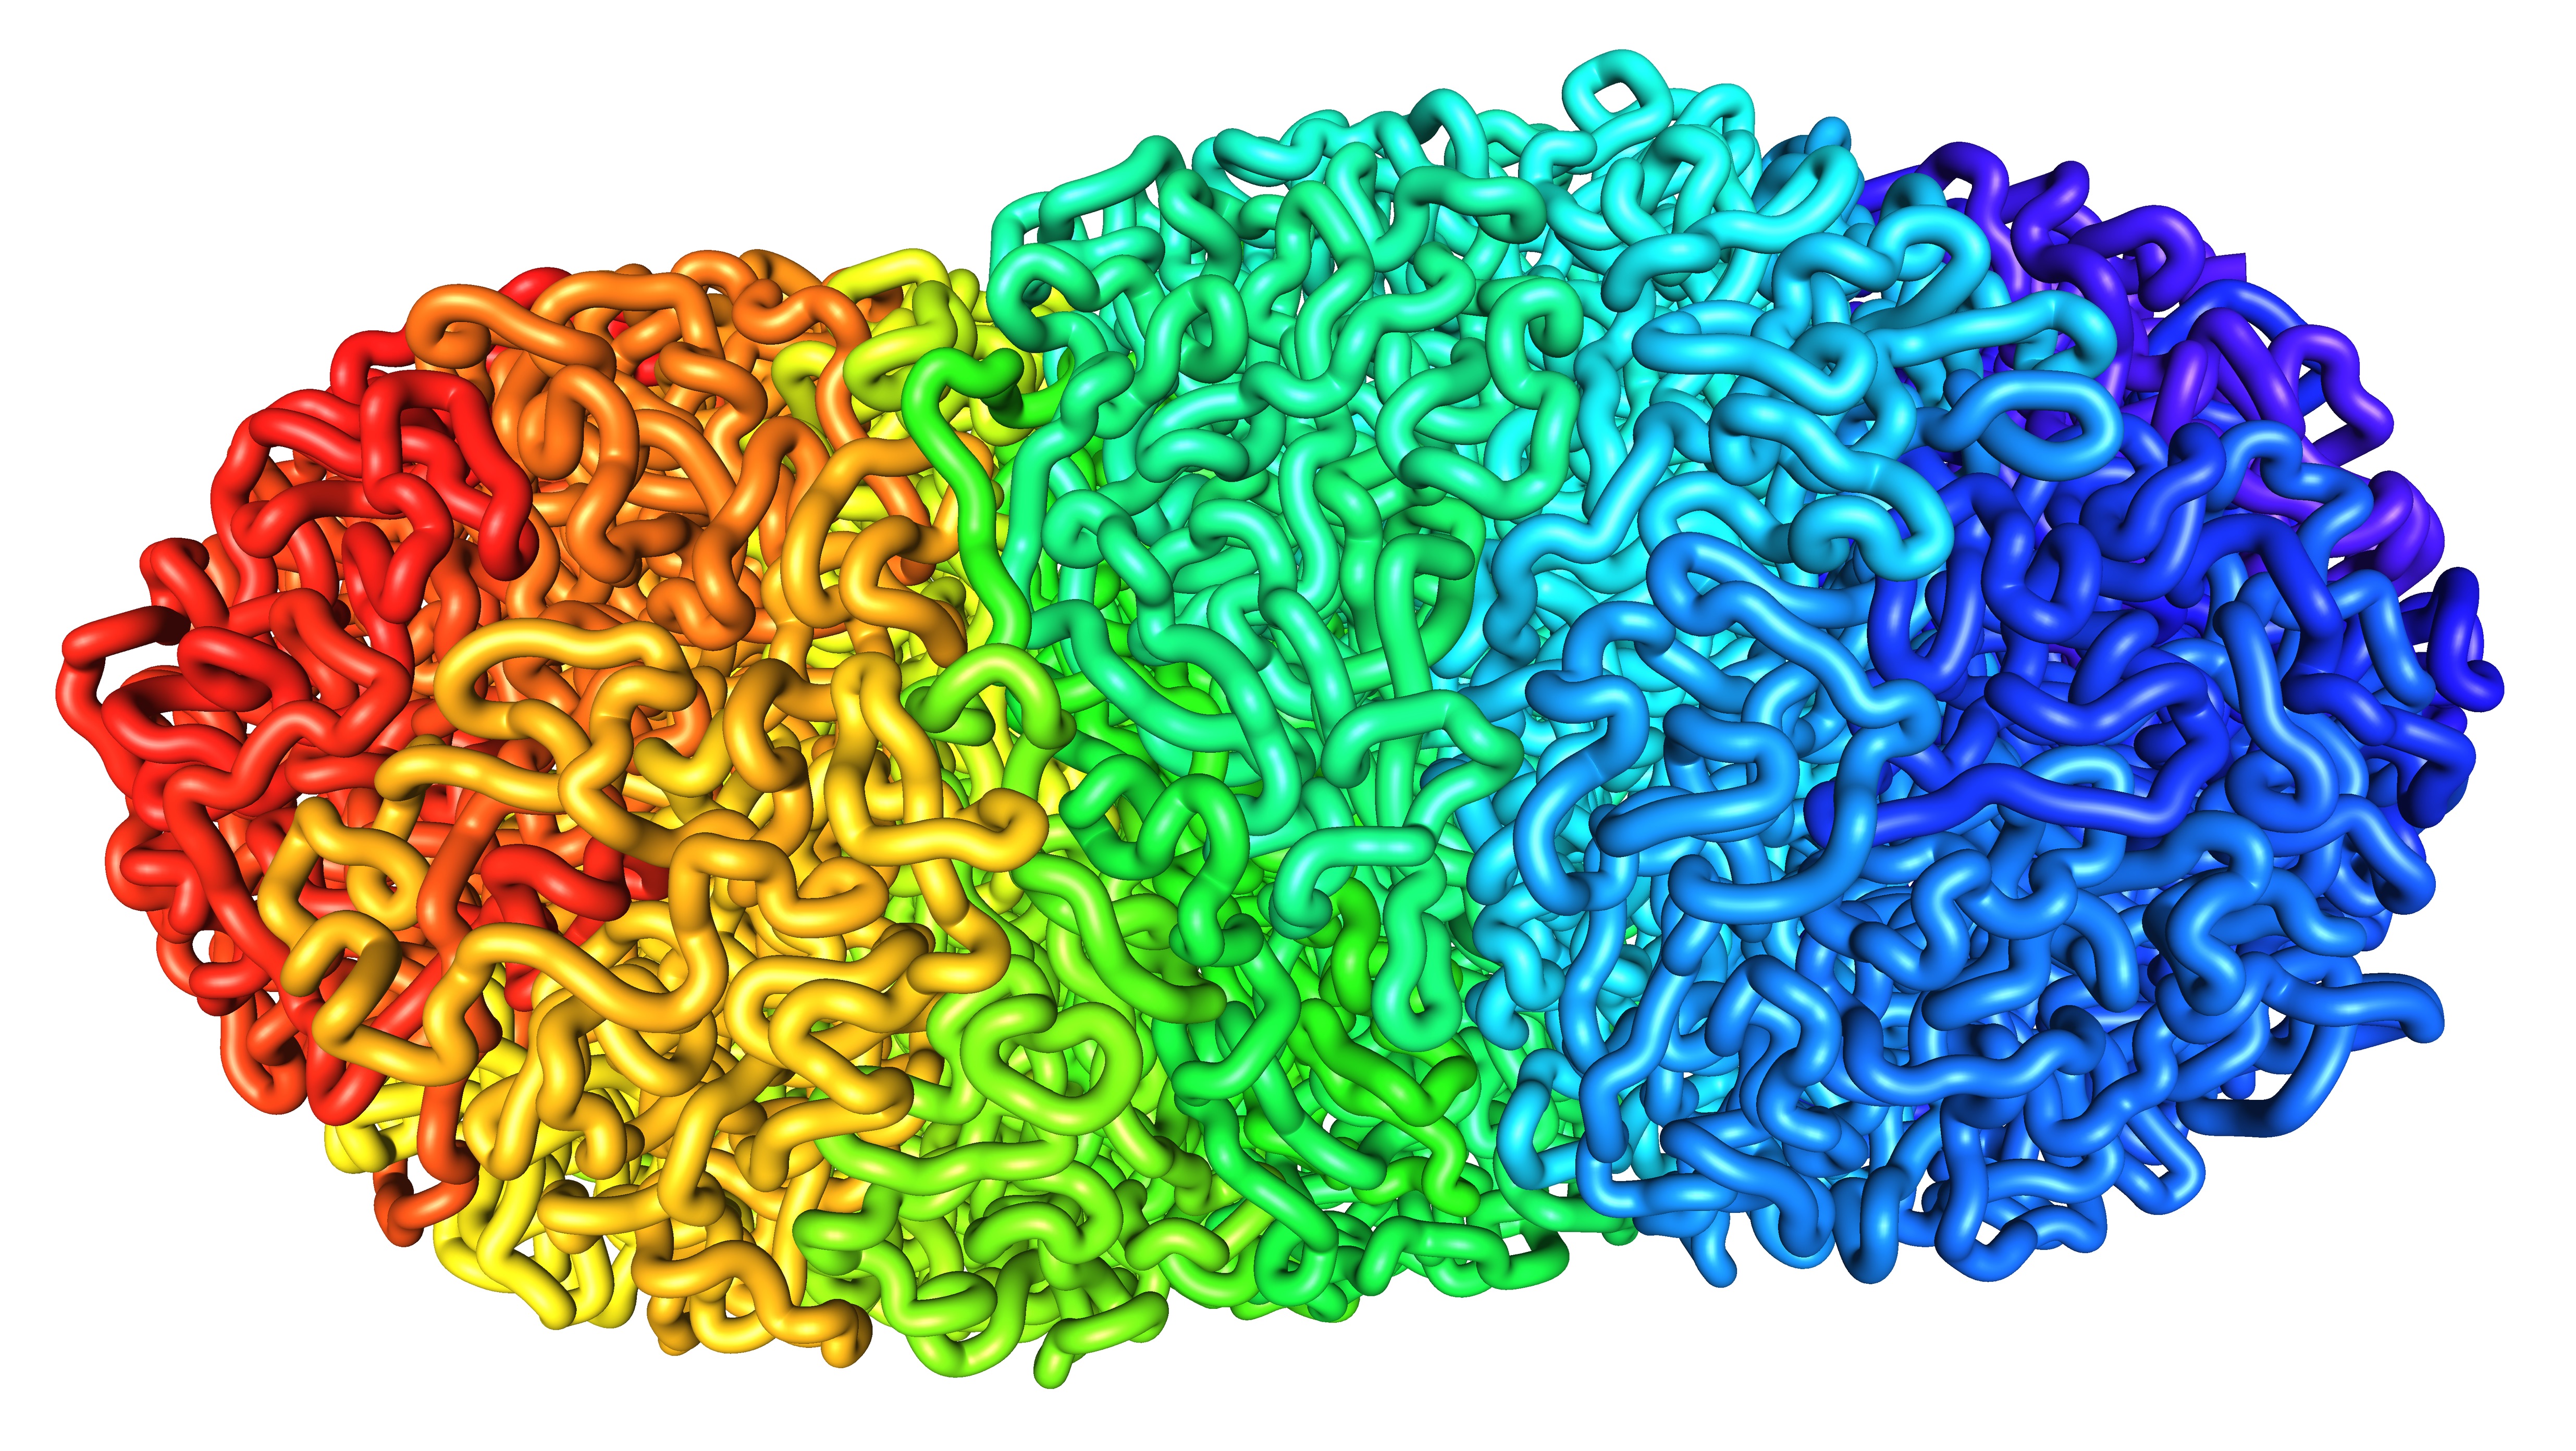
Fractal Globule
In this image, nearby regions on a chain of DNA are indicated using similar colors. The fractal globule is has a hierarchical organization; regions nearby along the chain are also nearby in 3D. The fractal globule is extraordinarily dense, but entirely unknotted. Our group's earlier work suggested that long stretches of DNA fold into fractal globules.
Credit: Miriam Huntley, Rob Scharein, and Erez Lieberman Aiden. -
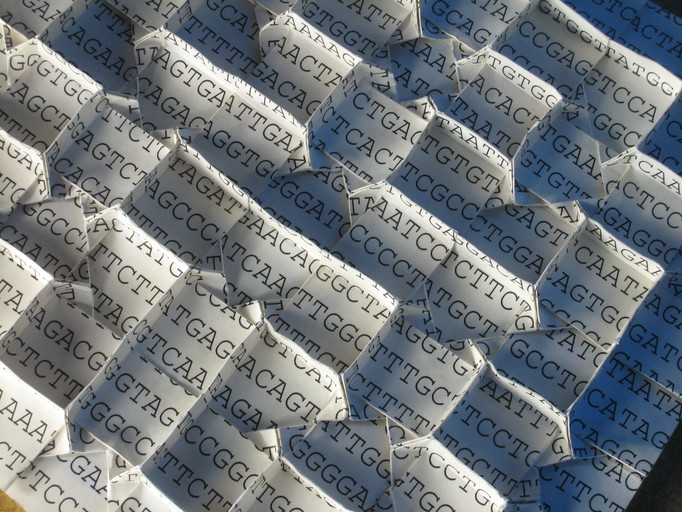
Chromosome 14 Origami 1
A segment of chromosome 14 folded to reveal a fractal curve using Origami, the Japanese art of paper folding. Our group's earlier work suggested that long stretches of DNA fold into Peano curve-like fractals.
Credit: Designed and folded by Jason Ku. Photo by Erik Demaine. -
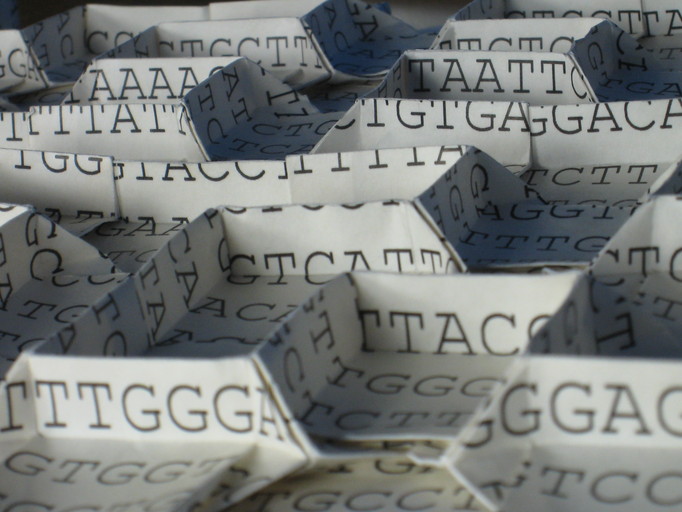
Chromosome 14 Origami 2
A segment of chromosome 14 folded to reveal a fractal curve using Origami, the Japanese art of paper folding. Our group's earlier work suggested that long stretches of DNA fold into Peano curve-like fractals.
Credit: Designed and folded by Jason Ku. Photo by Erik Demaine.